
When a user opens an application on a mobile device, the application gets assigned resources, which are responsible for keeping the application up and running. However, these devices have limited memory. If application memory use and requirements grow, the application will keep crashing because no available memory can be assigned.

To ensure efficient use of memory, devices use garbage collectors. A garbage collector helps clear the memory during the application runtime, which frees objects that are no longer needed by your application. Thus, the memory is reclaimed and ensures the device doesn’t crash.
However, in some cases, the garbage collector may fail to free up objects and claim their memory. This means the object continues to consume memory even when the application does not need them anymore, leading to inefficient memory usage. This scenario is what we refer to as a memory leak.
Memory leaks occur when an object that is supposed to be garbage collected has something holding a reference to it. As more and more instances of that object are created, older instances are still being retained in the application’s memory. Their prolonged stay in memory will eventually consume all the memory assigned to the application. The user will be notified of the application’s poor memory performance, and the app will finally crash.
As a developer, we have a role to play in avoiding this situation in our applications by building efficient memory usage. This guide will discuss how to detect and prevent these memory leaks in Android apps using Android Studio.
The Replay is a weekly newsletter for dev and engineering leaders.
Delivered once a week, it's your curated guide to the most important conversations around frontend dev, emerging AI tools, and the state of modern software.
Every Android developer needs to have knowledge of Android memory management, how it’s handled, and how it is organized. Part of this is identifying memory leaks in order to fix them.
Let’s discuss the two major methods of detecting memory leaks in Android. To do so, we will create a sample app with an intentional memory leak, then use it demonstrate how to detect and report the leak.
Using Android Studio, create a new Android project and follow the instructions below.
First, create a singleton class. A singleton class is a design pattern that restricts only one object in a class that is instantiated once per app execution. Here, only a single instance exists in your entire codebase, and you can’t create multiple instances of that object. It contains a static reference to itself so that this reference can be accessed from anywhere in your code.
We will demonstrate the leak scenarios using Java. However, this instance also applies to applications written using Kotlin.
To create a singleton, create a new class called SingletonClass. Then, create a static reference to the SingletonClass class like so:
public class SingletonClass {

    private static SingletonClass singletonClassInstance;

    private Context context;

    private SingletonClass(Context context){
        this.context = context;
    }

    public static void singletonClassInstance(Context context){

        if (singletonClassInstance == null){
            singletonClassInstance = new SingletonClass(context);

        }
    }
}
To execute the class, initialize its context inside the MainActivity’s onCreate method:
SingletonClass.singletonClassInstance(this)
The Android Profiler is an Android Studio component that provides an integrated view for real-time insight into your Android application’s performance.
We will use the memory profiler in Android Studio to see how it works, and how memory can be analyzed with the memory profiler features.
To use Android Profiler, ensure you have Android Studio v.3.0 or higher installed on your computer.
First, launch the Android Profiler from your Android Studio.
Once Android has launched your profile, click the + button to add a new session. Ensure you select the device that is running your application, and that you select the application package you have created.
When the season is created, a new profile will be launched to monitor the real-time performance of your app. We are interested in how the session records the memory usage.
Select the memory row by clicking anywhere along the blue row.
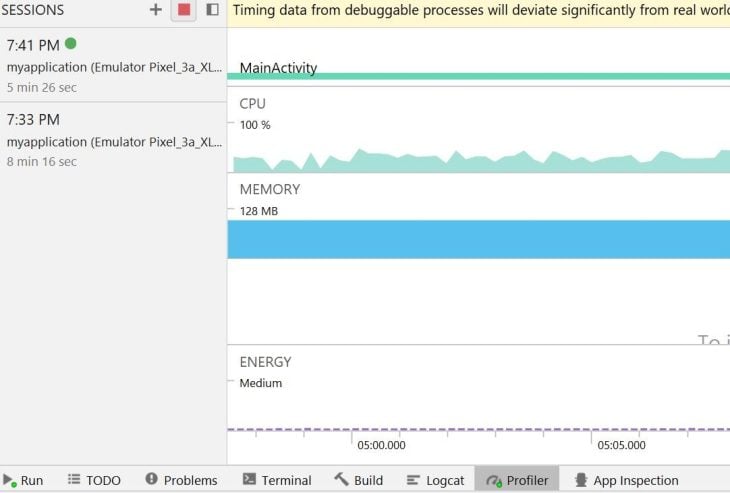
This opens a more detailed view that shows you how the application has consumed memory. For example, you can see how the memory was used up once the app launched MainActivity.
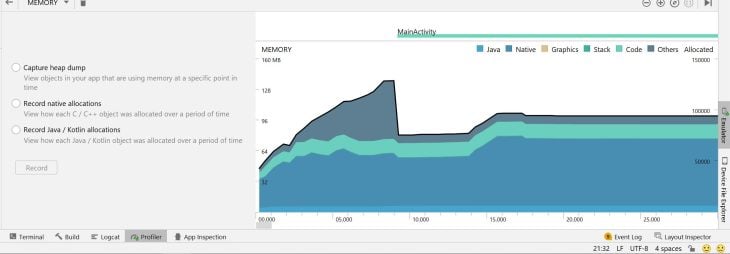
Up to this point, we haven’t figured out where a memory leak is likely to occur in our code. We need to track memory allocation to analyze garbage collection and detect any undesirable memory allocation patterns.
Here, we need to capture the heap dump and check the memory used by an object at a given time. Ensure your profiler has Capture heap dump selected and start the recording. It will take some time to generate the result.
We have seen how to use the Android Profiler to find a memory leak. It is a great tool to have as a developer, however, it can be time consuming, especially on a large project.
Luckily, there is a quicker alternative called LeakCanary.
LeakCanary is an Android memory leak detector that helps developers keep track and reduce the OutOfMemoryError crashes. It observes the Android application lifecycle to monitor activities and fragments, records and detects when activities, fragments, views, and view models are destroyed, and garbage collects their instances.
LeakCanary uses ObjectWatcher to hold weak references of destroyed objects. AppWatcher then watches the objects that are no longer needed. If these weak references aren’t cleared within five seconds, the watched instances are considered retained and flagged as possible leaking instances.
When the instances held by the ObjectWatcher reach a threshold of five retained objects while the app is running and visible, LeakCanary dumps a Java heap into a .hprof file stored in the file system. It then analyzes the heap to check the chain of references that prevent kept instances from being garbage collected.
Let’s digest this information with an example. First, add the LeakCanary dependency to your Android Studio application like so:
dependencies {
  //Add the debugImplementation as LeakCanary framework is supposed to only run in debug builds.
  debugImplementation 'com.squareup.leakcanary:leakcanary-Android:2.8.1'
}
Once you run the application LeakCanary will automatically be installed on your device. By opening the LeakCanary, you will see a detailed view of the leaks.
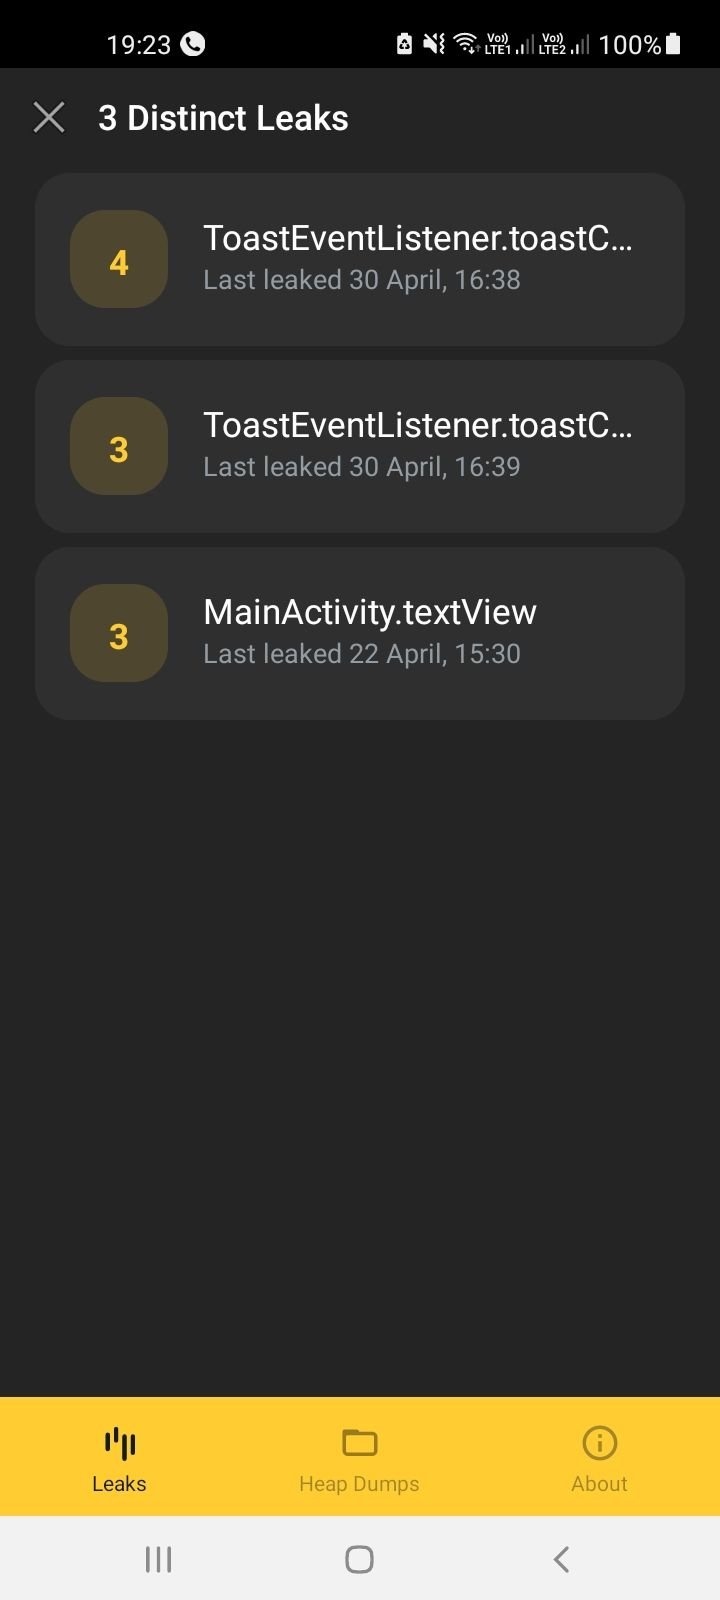
The details screen shows a trace of the memory leak that starts from the garbage collector root to the objects passing the leaked reference.
Many instances can lead to memory leaks in different components of your application. Below are some areas and tips that you should consider when writing your code.
ContextContext allows an application to communicate between different components. It allows you to create new objects, access resources (layouts, images, strings, etc.), and launch activities, databases, and internal storage of an Android device.
There are different ways you can use to access a context: this and getApplicationContext.
A context keeps a reference to another component. The way you use them in your application plays a key role.
Let’s take this example we used earlier, a singleton class:
public class SingletonClass {

    private static SingletonClass singletonClassInstance;

    private Context context;

    private SingletonClass(Context context){
        this.context = context;
    }

    public static void singletonClassInstance(Context context){

        if (singletonClassInstance == null){
            singletonClassInstance = new SingletonClass(context);

        }
    }
}
In this case, we are accessing SingletonClass class in MainActivity using SingletonClass.singletonClassInstance(this). To get the SingletonClass data, we are using the parameter this to get its context.
In this case, context is a Java class. It provides a way to get information about your application components or other operating-system features.
However, you will notice that executing the SingletonClass in MainActivity using the this context will leak the activity.
Context is tied to the lifecycle of the entire application. Thus, any wrong usage of a context can lead to memory leaks. Ensure you check where and when you use different contexts.
For example, getApplicationContext can be used when your object lives beyond your activity lifecycle. It cannot, however, be used to reference any UI-related components. If you have a singleton, always ensure you are using the ApplicationContext.
Additionally, this can be used when the object does not live past the activity lifecycle. It can be used to reference UI components. UI components are not long-running operations and can’t live beyond the activity lifecycle. This context can be used in different operations, such as XML layouts, dialogue, getting resources, or starting an activity.
In our example, we have a memory leak because we haven’t used the proper context. Let’s try to fix it. We are using a SingletonClass, thus there can be only one context-implementing object, so it would be appropriate to use getApplicationContext.
getApplicationContext is singleton context. It doesn’t matter how many times you access the context, you will get the same instance. Thus, its instance doesn’t create a new context.
Executing the SingletonClass as shown below will solve the memory leak:
SingletonClass.singletonClassInstance(getApplicationContext());
Excessive use of static members can sometimes lead to memory leaks in your application. A static member has an increased life span that can stay live almost whenever the application runs. When your application loads a class into the Java virtual machine (JVM), its static members are allocated to the memory. Because of their increased lifespan, they will remain in the memory until the class becomes eligible for the garbage collection.
Let’s create a static view and see how it behaves in relation to the memory leak.
Initialize this TextView from your XML file using a static variable:
private static TextView textView;
Create a class to update the TextView values:
private void changeText() {
    textView = (TextView) findViewById(R.id.testview);
    textView.setText("Update Hello World greetings!");
}
Now, execute the class inside the onCreate() method:
changeText();
Note that this static view is part of the activity executing the changeText() class. Thus, it will hold the static reference to that particular activity. The static view keeps on running even beyond the activity’s lifecycle. This way, the activity will not be garbage collected, because the view is still holding a reference to the activity. This will create a memory leak for this activity.
Static is used to share the same variable of a given class across all objects. If the view must be held statically, we can destroy its reference inside an onDestroy() to avoid memory leaks. This way, when the activity is destroyed, its static reference will also get destroyed, allowing the activity to be garbage collected:
@Override
protected void onDestroy() {
    super.onDestroy();
    textView = null;
}
This example will be effective; however, to avoid this from happening, best practice is to always initialize the view without using the keyword static. If it is unnecessary, it is best not to be held statically:
private TextView textView;
Below is another example of a static reference to the activity context that will cause leaks to the activity:
private static Context mContext;
Execute it inside the onCreate() method:
mContext = this;
Even Android Studio will warn you of a possible leak that can be associated with this static field.

To fix this, it’s best not to hold it statically. If it must be placed in a static field, use a virtual/ weak reference to hold it:
private static WeakReference<Context> mContext;
Execute it inside the onCreate() method:
mContext = new WeakReference<> (this);
You can also fix this by setting it to null inside the onDestroy() method.
Threaded code is extremely likely to introduce memory leaks in your apps. Threads decompose an execution logic into multiple concurrent tasks.
Android uses threads to process multiple tasks that execute concurrently. Threads don’t have their own execution environment, so they inherit the execution environment from the parent task. Therefore, threads can easily communicate and exchange data with one another within the bounds of a single process.
Let’s glance at how a basic thread can lead to memory leaks in Android.
First, initialize a thread task:
private final ThreadedTask thread = new ThreadedTask();
Next, set up a threaded task:
private class ThreadedTask extends Thread {
    @Override
    public void run() {
        // Run the ThreadedTask for some time
        SystemClock.sleep(1000 * 20);
    }
}
Finally, execute the task inside the onCreate() method:
thread.start();
When the ThreadedTask is launched, it will take some time before its execution finishes. If you close the activity before the task execution is over, the running ThreadedTask will prevent the activity from being garbage corrected. Having a reference to view, activity, or context in something that happens in the background will potentially cause a memory leak if not done carefully.
To fix this leak, you can use a static class. The static class does not have a reference to the enclosing activity class. Alternatively, you can stop this thread whenever the activity is destroyed using the onDestroy():
// make ThreadedTask static to remove reference to the containing activity
private static class ThreadedTask extends Thread {
    @Override
    public void run() {
        // check if the thread is interrupted
        while (!isInterrupted()) {
            // Run the ThreadedTask for some time
            SystemClock.sleep(1000 * 20);
        }
    }
}
If the activity is destroyed, isInterrupted() will return true, and the thread will be stopped:
@Override
protected void onDestroy() {
    super.onDestroy();
    //kill the thread in activity onDestroy
    thread.interrupt();
}
Handler is a Java background thread. It keeps running in the background and executes different tasks sequentially until the application quits the thread execution.
Handler is mainly used to communicate with the application UI and update different components based on the execution thread. A good example of a handler application is in a progress bar. The handler will use loopers to create message queues, so you can use it to schedule messages and update the UI based on different repeating tasks.
Because handlers are threads and execute multiple times, there is a possibility of a memory leak happening based on how you write them.
Below is a basic handler in Android.
First, initialize a handler task.
private final Handler handler = new Handler(Looper.getMainLooper());
Then, execute the task inside the onCreate() method:
handler.postDelayed(new Runnable() {
    @Override
    public void run() {
        textView.setText("Handler execution done");
    }
    // delay its execution.
}, 1000 * 10);
When this handler is executed, it registers a callback in the activity. This will prevent the activity from being garbage collected, causing memory leaks.
To fix this, you must ensure you remove any callbacks. Threads communicate and exchange data with one another within the bounds of a single process. Thus the callbacks involved must be removed when the onDestroy() method is called.
This will remove the handler references and resolve the memory leak:
@Override
protected void onDestroy() {
    super.onDestroy();
    //remove the handler references and callbacks.
    handler.removeCallbacksAndMessages(null);
}
There are many instances where threads can leak in your apps. To ensure threaded execution is well written, ensure the thread lifecycle is fully executed from when the thread is created and when terminated. Additionally, be sure to observe any implicit references from the inner class to the outer (parent)class
There are many instances where leaks can occur. Other instances where leaks can take place include:
ListView bindingAsyncTaskMemory leaks can easily be overlooked even by experienced Android developers. The above are some common scenarios where leaks are likely to occur. However, leaks can occur in any part of your application based on your code.
The best practice is always to run your application using any of the methods discussed so you can catch and prevent memory leaks before shipping your app.
Install LogRocket via npm or script tag. LogRocket.init() must be called client-side, not
server-side
$ npm i --save logrocket

// Code:

import LogRocket from 'logrocket';
LogRocket.init('app/id');
// Add to your HTML:

<script src="https://cdn.lr-ingest.com/LogRocket.min.js"></script>
<script>window.LogRocket && window.LogRocket.init('app/id');</script>

Write agent-friendly API documentation with OpenAPI, clear schemas, workflow guidance, and llms.txt for safer AI automation.

Local AI proxy tutorial for detecting, masking, and rehydrating PII before prompts reach cloud LLMs.

Learn how Graph RAG uses connected knowledge structures to improve retrieval beyond simple text similarity.

Learn how sibling-index() enables clean, JavaScript-free stagger animations using native CSS.
Would you be interested in joining LogRocket's developer community?
Join LogRocket’s Content Advisory Board. You’ll help inform the type of content we create and get access to exclusive meetups, social accreditation, and swag.
Sign up now