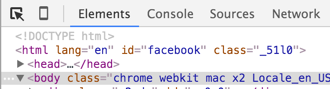
The dev tools offer a number of ways to select elements, the most convenient of which is the selection mode. This tool, activated by pressing the mouse icon in the upper-left corner of the dev tools panel (or with cmd + shift + c), lets you select elements on the page simply by clicking on them. Once activated, you can move your mouse around the page and preview selection, then click to select an element to inspect.
This tool is great for quickly selecting an element on the page since hitting cmd+shift+c will open the dev tools and go straight into selection mode.
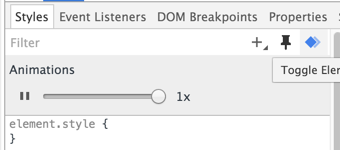
Recently, the Chrome team has added a number of new features for debugging and creating animations. Clicking the icon in the upper-right corner of the “Styles” tab reveals a slider that lets you limit the speed for all animations on a site. You can also pause all animations which is particularly useful for a site that is busy with animated content.
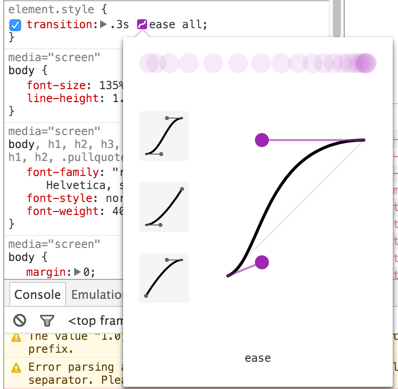
Another fantastic tool that was recently added to the elements panel is the animation inspection tool. This lets you view the motion curve for an animation, and fine tune its properties. In addition, you can use the arrow icons to scroll through a list of preset animations to apply to your element.
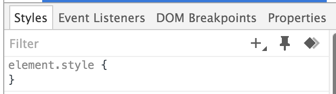
Another handy tool for styling elements is the element state simulator, which is accessed by clicking the thumbtack icon in the upper-right corner of the Styles panel. This tool lets you simulate the element pseudo states of hover, active, focused, and visited and view styles that are associated with those selectors.
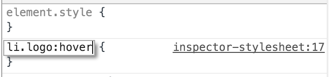
To add styles for those pseudo states, simply add a new selector (with the ‘+’ icon) and add :<state> to the end of the selector string. For example, to add a hover rule to an li with class ‘logo’, make a new selector, ‘li.logo:hover’, and add styles there. You can then test your styles by checking the ‘:hover’ element state to simulate hovering on the element.

Debugging or viewing minified JavaScript and CSS is virtually impossible, but luckily Chrome provides a tool that makes doing so a bit easier. After opening a minified file in the “Sources” tab, you can click the brackets logo in the lower left corner of the file, and Chrome will “prettify” the code. This works quite well with CSS files, and does a decent job with JavaScript, though some information (like variable names) is lost in the minification process.
For more tips on using the Chrome dev tools, check out part 2 of this series.
The Chrome dev tools only work if you’re running your app on your own machine. If you’re interested in understanding bugs and performance issues that users see in production, try LogRocket.
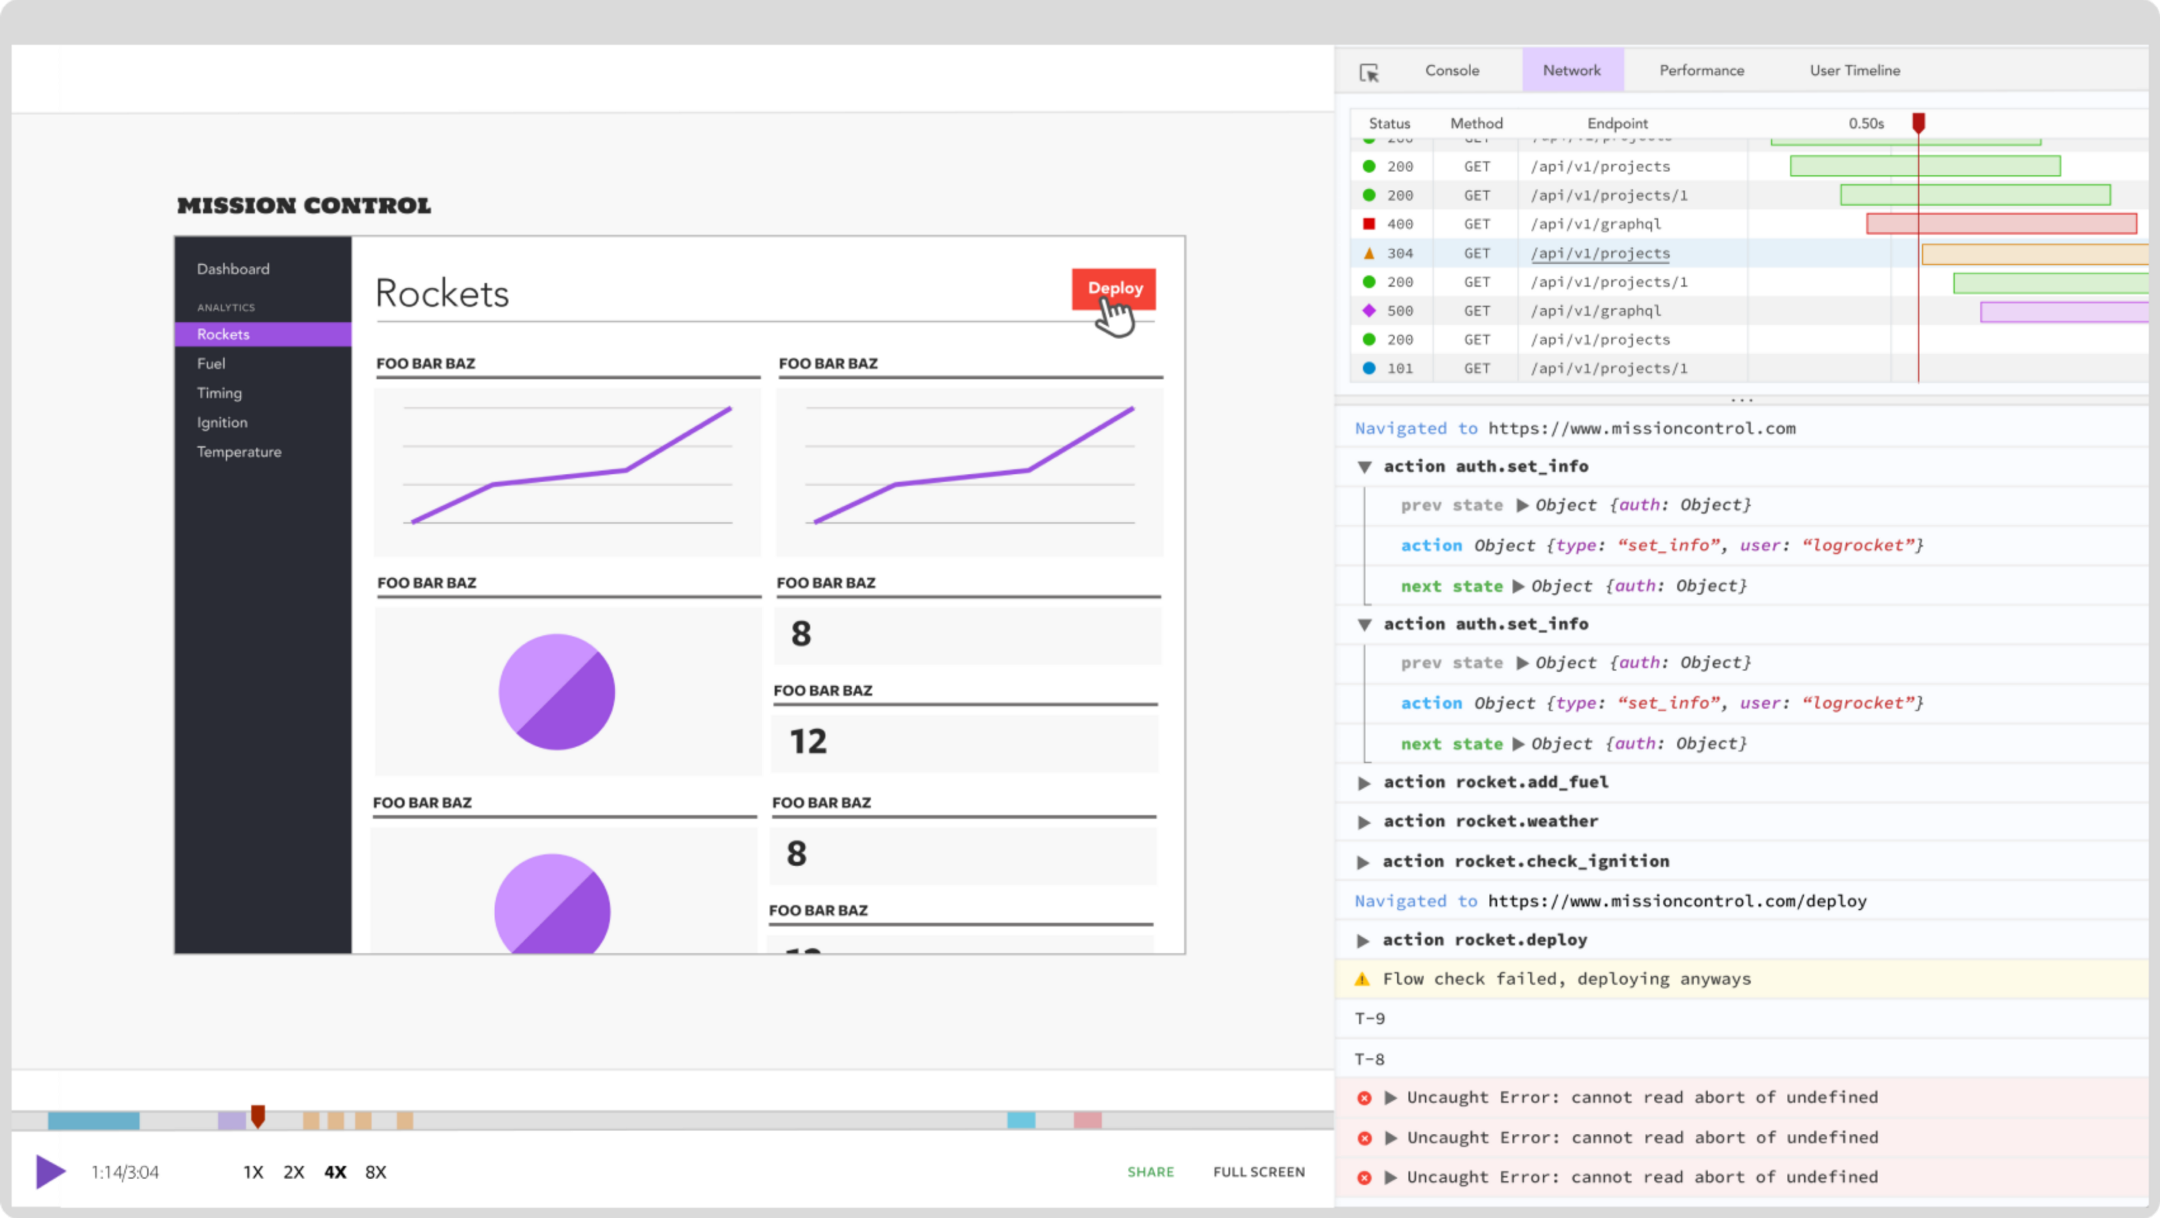
LogRocket is a front-end logging tool that lets you replay problems as if they happened in your own browser. Instead of guessing why errors happen, or asking users for screenshots and log dumps, LogRocket lets you replay the session to quickly understand what went wrong. It works perfectly with any app, regardless of framework, and has plugins to log additional context from React, Angular, and Vue.js.
LogRocket instruments your app to record console logs, network requests/responses with headers + bodies, browser metadata, Redux actions/state, and performance timings. It also records the HTML and CSS on the page, recreating pixel-perfect videos of even the most complex single-page apps.
You can check out LogRocket here.
Would you be interested in joining LogRocket's developer community?
Join LogRocket’s Content Advisory Board. You’ll help inform the type of content we create and get access to exclusive meetups, social accreditation, and swag.
Sign up now
Discover how to use Gemini CLI, Google’s new open-source AI agent that brings Gemini directly to your terminal.

This article explores several proven patterns for writing safer, cleaner, and more readable code in React and TypeScript.
A breakdown of the wrapper and container CSS classes, how they’re used in real-world code, and when it makes sense to use one over the other.
This guide walks you through creating a web UI for an AI agent that browses, clicks, and extracts info from websites powered by Stagehand and Gemini.

