Performance and usability have slowly become a top priority for a majority of companies as they both have a huge effect on user experience. Understandably, testing for both and optimizing to improve them has become essential to the success of any web-based application.

On the testing end, Lighthouse has emerged as a popular choice due to its ease of use and (now) versatility. Lighthouse is an open-source tool created by Google to perform a number tests called audits with the aim of improving site performance and usability.
It is used as a baseline by a majority of the frontend web development community to assess various performance and usability metrics of web pages and apps. Its audits involve loading your web application over a weak simulated 3G connection while viewing it on a slow device.
It also simulates packet loss and network and CPU throttling. Then, it creates a report on how well the app or page performed. The metrics audited are performance, search engine optimization, best practices, progressive web apps, and accessibility.
The Replay is a weekly newsletter for dev and engineering leaders.
Delivered once a week, it's your curated guide to the most important conversations around frontend dev, emerging AI tools, and the state of modern software.
Lighthouse gives us lots of workflows to choose from. This way, we can pick one that suits us best and run an audit with it.
Run Lighthouse on web.dev and get reports without installing a thing:
Run Lighthouse via the command line:
You need to have Google Chrome installed on your device
-g flag installs it as a global module):npm install -g lighthouselighthouse <url>N.B: Use lighthouse --help to access a few more options.
Run Lighthouse via Chrome DevTools (useful for pages that require authentication):
You need to have Google Chrome installed on your device
Run Lighthouse from a browser extension:
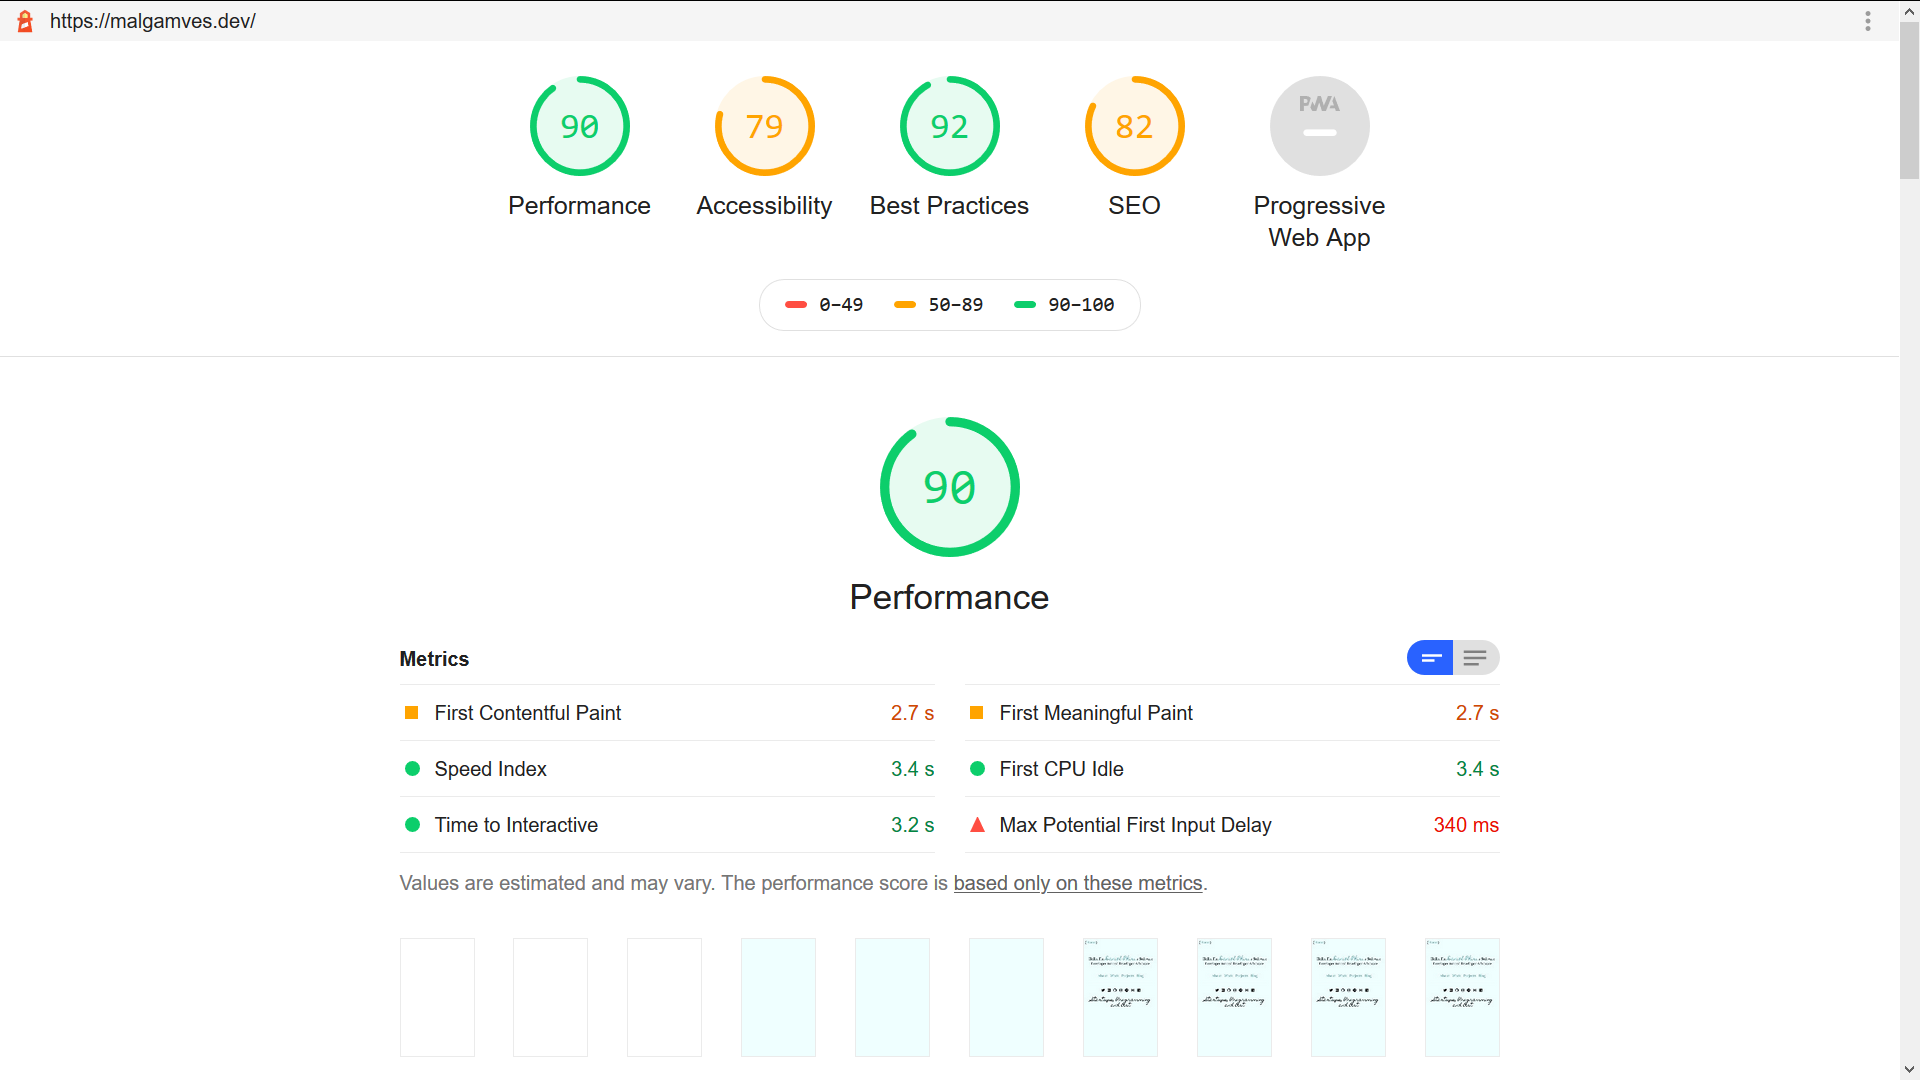
With any of the methods mentioned above, after running the audit you should get a report that looks like this:

This is a test I ran on my website – malgamves.dev (Clearly I have some work to do.)
You’ll notice we get back a couple of scores for each of the metrics I mentioned in the opening paragraph. These are on a scale of 0-100, making it easier to determine whether a site is “better” than it’s previous version.
The goal here is to improve your score by acting on the feedback you’re given.
Opportunities are suggestions that you can use to improve your site’s performance. Let’s go a little deeper into these metrics.
Lighthouse’s perspective of performance is mainly focused on the user’s perception of speed (how quick things show up on the screen) rather than actual speed. It checks against the following metrics: First Contentful Paint, Speed Index, Time to Interactive, First Meaningful Paint, First CPU Idle, and Max Potential First Input Delay.
These play a huge part in making things appear on the screen as quickly as possible, thus improving the user’s perception of the application’s speed.
Lighthouse will check that your webpages are optimized for search engine result rankings. It checks some SEO best practices, like whether documents use legible font sizes, have a valid robots.txt file, and use page tags and status codes.
Most of the SEO tests are pretty basic, so you don’t want to rely on Lighthouse as your go-to SEO tool. It’s important to note that the Lighthouse team is working on expanding and improving the SEO audit.
For this, Lighthouse checks your web pages to ensure they’re following standard best practices for the web. Some of these include checking if applications have no errors logged to the console, if deprecated APIs are avoided, if a page is accessible over HTTPS, if the application cache is valid, if geo-location access is requested, and if images are displayed with the correct aspect ratio.
For this audit, Lighthouse checks the accessibility of your web application.
It checks if image elements have alt attributes, if the <html> element has a lang attribute, if the document has a <title> element, if background and foreground colors have enough contrast, if link names work, and if viewport is viewer-scalable.
Lighthouse will check your web page against a set of criteria which defines progressive web apps.
This particular audit doesn’t give your page a score, but rather a pass or fail depending on whether your page meets the criteria or not, like whether your app redirects HTTP to HTTPS, response code, fast loading on 3G, splash screen, viewport, etc.
It’s worth noting though that (as of writing this post) very soon there will be a significant change to the way Lighthouse scores web pages. So if you’re using any third party tests based off of Lighthouse, make sure they get updated to Lighthouse 6.
This blog post provides a nice summary of what will change. I also recommend having a look at the Changelog to see what changes are coming.
There’s a really cool web app you can check out to see what audit scores will look like before and after the major update.
Now we have an overarching understanding of what a Lighthouse test is, how we can perform one, and what the audit reports and scores mean. It’s worth mentioning that the point of this article is to share a few ways you and your team can get the most of of your Lighthouse tests.
In most dev scenarios, you have a team contributing to a project over some sort of version control — usually Git. This means there’s lots of changes to your application and these changes might negatively affect your Lighthouse audit scores.
Remember, the goal is to maintain and improve. This is why Lighthouse is slowly becoming a core part of many frontend teams’ CI, with people choosing to run a Lighthouse-driven style of development as they go on and create web pages.
Lighthouse CI can be added to your project repo, and that way you can keep track of test scores past and present before merging changes from various contributors that might affect your applications overall score.
After running your Lighthouse test, you get a couple of suggestions for actions that could help improve your score.
Right after a lot of those suggestions are a few optional tips that wouldn’t necessarily improve your score because they aren’t automatically tested.
Running a manual test and fixing them would definitely make for a better user experience, though. When it comes to accessibility, for example, not all pointers can be found in the report but referencing a guide to manual accessibility testing makes your app more accessible.
Similarly, with progressive web apps, we have a checklist with some items not covered in the automated test report which would make for a better experience. The devil is in the details, so go the extra mile and run some of the optional manual tests.
Use Lighthouse as a guiding light and not as a source of universal truth. It’s important to note that Lighthouse isn’t the holy grail of web standards, but it can get close.
This post titled Building the most inaccessible site possible with a perfect Lighthouse score sums up the message pretty well.
Using automated tools like Lighthouse is a great way to start your journey towards making better performing and more accessible sites.
But like its name suggests, it isn’t the destination. It’s just a tool that helps you when you’re lost in the rough seas of modern web application development. It provides a guide for you to act on and helps point you in the right direction towards industry best practices. It’s important not to get lost.
I remember running a Lighthouse test and getting this alert: Chrome extensions negatively affected this page’s load performance. Try auditing the page in incognito mode or from a Chrome profile without extensions.
I run an ad-blocker and a few other extension that stop certain sites from tracking my movement as I surf the web. Sometimes this means I can’t get a couple of fonts from Google or access content on a CDN.
Whatever it might be, if you use a browser to run your Lighthouse tests, run them free of extensions in incognito mode to get more accurate results.
Most Lighthouse updates come with minor changes to scoring with only a few having very significant overhauls. Staying up to date and making sure everyone on your team is on the same version can help avoid inconsistencies and eventually poor web experiences.
Keep in mind that different Lighthouse workflows update differently — the extension is auto-updating by default, and the DevTools version will only be updated when updating Chrome.
It’s also important to remember that lots of unofficial or third party tests take a while to update to the latest standard. Lighthouse may have been updated since your last report, so be sure to check the changelog often.
Hopefully this gives you a better idea of how to use Lighthouse more effectively! Please share your Lighthouse scores with me on Twitter.
Let’s create a faster, more accessible and enjoyable web experience for everyone.
Happy testing! Take care and stay safe
As web frontends get increasingly complex, resource-greedy features demand more and more from the browser. If you’re interested in monitoring frontend performance and more for all of your users in production, try LogRocket. https://logrocket.com/signup/
LogRocket is like a DVR for web apps, recording everything that happens in your web app or site. Instead of guessing why problems happen, you can aggregate and report on key frontend performance metrics, replay user sessions along with application state, log network requests, and automatically surface all errors.
Modernize how you debug web apps — Start monitoring for free.

A step-by-step guide to building your first MCP server using Node.js, covering core concepts, tool design, and upgrading from file storage to MySQL.

Using security headers in your Next.js apps is a highly effective way to secure websites from common security threats.

A deep dive into April 2026’s AI model and tool rankings. We break down performance, usability, pricing, and real-world capabilities across 50+ features to help you pick the right tools for your development workflow.

A practical guide to Agent Browser CLI. Learn how AI agents navigate, snapshot, and interact with web pages using stable references, enabling efficient automation and exploratory testing.
Would you be interested in joining LogRocket's developer community?
Join LogRocket’s Content Advisory Board. You’ll help inform the type of content we create and get access to exclusive meetups, social accreditation, and swag.
Sign up now