Static code inspection, or static source code analysis, as it is fondly called, is a debugging technique adopted during code reviews where the program being debugged is not executed.

There are several code analysis tools available to software engineers, such as SonarQube, Coverity, and Codacy.
In this article, we’ll discuss how to set up SonarQube within Docker, show how to configure it for your language of choice, and produce reports on code quality. We’ll also introduce the entire SonarQube toolchain and demonstrate how to use SonarQube on Docker to build and test a Go application.
The Replay is a weekly newsletter for dev and engineering leaders.
Delivered once a week, it's your curated guide to the most important conversations around frontend dev, emerging AI tools, and the state of modern software.
To follow the tutorial portion of this article, you’ll need the following:
SonarQube is a popular continuous inspection tool for code quality and code security that aims to help development teams ship better software. It functions as an automatic code review tool with support for more than 30 programming languages.
SonarQube easily interfaces with CI pipelines and DevOps builds to make code inspection swift and efficient for engineers. It is also self-managed, satisfying the need for developers to ship quality and maintainable code at a fast pace.
SonarQube is a core element of the Sonar ecosystem, including SonarLint and SonarCloud. The entire Sonar ecosystem is focused on helping developers write clean code that is highly maintainable.
The ecosystem comprises solutions for individual developers, teams, and enterprises. There is also an active community in which open source contributors can contribute to improving the tools.
The SonarLint solution can be installed to analyze code in real time and gain live feedback on the go. SonarCloud enables developers to review and report changes to code on version control software, as well as evaluate code for production. SonarQube, which we have seen, has the same features as SonarCloud, with the difference being enterprise features as against self-managed ones.
SonarQube offers tools for static code analysis in detecting bugs, eliminating security vulnerabilities, automating code review, and code quality assurance. SonarQube relies on a terminal and its CLI tool, named SonarScanner, to run and report test results.
Technically, you first download the SonarQube image from the Docker Hub. After, you have to install SonarScanner CLI for your operating system.
Projects are created and tested on the SonarQube dashboard. To access the dashboard, you must free up a port to act as a server and point the SonarQube docker container to that port, accessible through the localhost IP address.
SonarQube will have access to test a project only when added to the project’s test folder. The SonarScanner tool, which reports to SonarQube, must have a corresponding port number.
Now that we have a better understanding of what SonarQube is and how it functions, let’s see how to use SonarQube on Docker for code coverage, scanning vulnerabilities, and code analysis.
Getting SonarQube on Docker simply involves grabbing the image from Docker Hub. If you use a Linux machine, you’ll need to set the recommended base configurations using the commands provided by Docker under “Docker Host Requirements”.
Next, launch the Docker daemon in a separate terminal. On the terminal, run the below command to start a server:
docker run -d --name sonarqube -p 9000:9000 sonarqube
You can access the SonarQube instance with the host IP address and the specified port (localhost:9000, in our example).
When the SonarQube portal homepage appears, go ahead and log in; use the default username and password (“admin”). Next, you’ll be asked to update your password:

Viola! You’re ready to begin using SonarQube on Docker.
SonarScanner is a CLI tool that is used to run SonarQube tests. To view the test results, SonarScanner sends feedback from the test to the SonarQube server for you to review. You can download SonarScanner here.
Select your operating system and download the file.
After extracting the contents of the zip file, navigate to conf/sonar-scanner.properties and ensure the default server port is the same as your SonarQube port. This will allow SonarScanner to send analysis results to SonarQube.
Now, add SonarScanner’s bin folder to your machine’s environment $PATH. On Windows, the procedure involves following these steps:
sonar-scanner
If you require more information about debugging in the SonarScanner CLI, use either of these flags with your commands: -X, --verbose, or -Dsonar.verbose=true.
Alternatively, you can run SonarScanner from the Docker image with the below command:
docker run \\
    --rm \\
    -e SONAR_HOST_URL="<http://$>{SONARQUBE_URL}" \\
    -e SONAR_LOGIN="myAuthenticationToken" \\
    -v "${YOUR_REPO}:/usr/src" \\
    sonarsource/sonar-scanner-cli
So far, we’ve installed two Sonar services on Docker. Now, let’s see how to use them in actual scenarios.
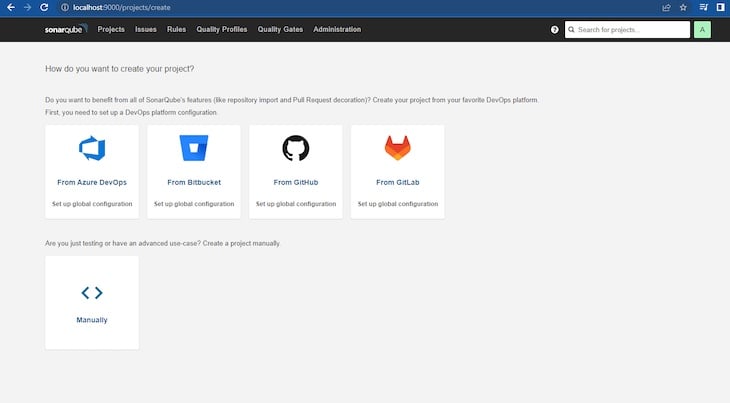
To create a new SonarQube project, run the SonarQube container on Docker and navigate to the homepage via localhost.
Next, click the Projects bar on the homepage, and decide how you want to create a new project. Add a project key and display name for the demo.
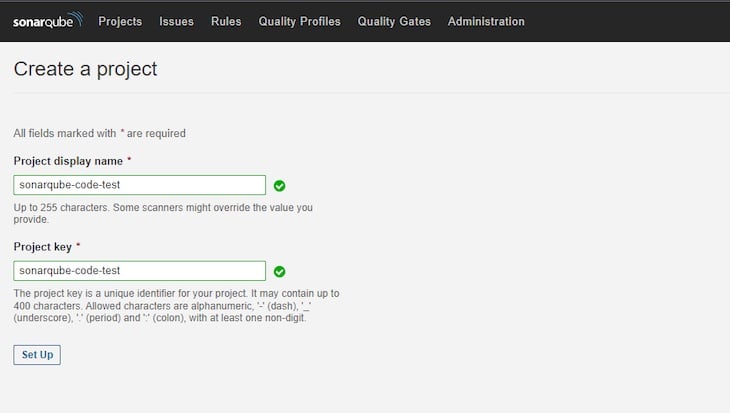
For this demo, we’ll use the manual mode. After clicking Manual, you’ll see fields displayed for the Project display name and Project key:

After completing these fields, click Set Up. In the next window, select Locally. In the window after that, click Generate to generate a token for your project. Then, click Continue to finish up with the tokenization.
Next, select your preferred language. For this project, we’ll use Go, so we’ll select the Other option.
Now, select your OS and follow the stipulated instructions.
Tokens are used in every project. To generate a token, click on the User icon to the right of the search bar. Then, click on the Security tab and generate a new token.
The token required for our project is already available in the project’s page under Run analysis on your project.
As mentioned above, we’ll use a sample program built with Go to demonstrate the use of SonarQube for static code analysis. In an existing project use case, you only need to navigate to the test folder in your codebase to use SonarScanner.
Create a program source file and write the program you wish to inspect, along with the program’s test file.
Our addition program is simply the following:
package adder

func AddNumbers(x, y int) int {
    return x + y
}
We’ll use the following test for the program:
package adder_test

import (
    "testing"

    "github.com/username/sonarqube-code-test/adder"
)
func TestAddNumbers(t *testing.T) {
    solution := adder.AddNumbers(6, 5)
    expected := 11
    if solution != expected {
        t.Error("result is incorrect: expected 5, got", solution)
    }
}
Now, we’ll make use of the SonarScanner we downloaded for analyzing the code. Start by configuring the SonarScanner CLI tool with an access token for the admin account:
sonar-scanner -Dsonar.login=myAuthenticationToken
From your terminal, navigate to the folder where your code’s test file is saved and run the command provided for the project:

If you generated the token yourself for a particular project, just edit and use the following code:
sonar-scanner -D sonar.host.url=http://localhost:9000 -D sonar.projectKey=<Your-Project-Key> -D sonar.projectName="Your Project Name" -D sonar.projectVersion=<SemVer> -D sonar.login=<Your-Token-Here> -D sonar.test.exclusions=tests/**/*.cs
After running the above command, the test results will show on the terminal’s screen, with an EXECUTION SUCCESS message, like so:

Now, visit the SonarQube dashboard and navigate to Projects. You’ll find the test results there:

Congratulations, you’ve successfully run a test with SonarQube on Docker!
In this article, we provided an overview of the Sonar ecosystem and how SonarQube functions. We also demonstrated how to install SonarQube on Docker and then use it to build and test a Go application.
While this article makes use of SonarQube locally, it can preferably be run on a Kubernetes cluster deployed to any number of environments. SonarQube will act as a safety ground for developers in the development environment. It can also be used in the production environment to confirm clean code. Developers and QA may find SonarQube’s SonarLint useful for debugging code.
Install LogRocket via npm or script tag. LogRocket.init() must be called client-side, not
server-side
$ npm i --save logrocket

// Code:

import LogRocket from 'logrocket';
LogRocket.init('app/id');
// Add to your HTML:

<script src="https://cdn.lr-ingest.com/LogRocket.min.js"></script>
<script>window.LogRocket && window.LogRocket.init('app/id');</script>

Learn how Vite+ unifies Vite, Vitest, Oxlint, Oxfmt, Rolldown, and Node.js management in one CLI.

AI companies are buying developer tools as coding agents turn runtimes, package managers, and linters into strategic infrastructure.

Learn how AI-assisted development governance uses rules, agents, hooks, and protocols to help AI coding tools produce safer, more consistent code.

A step-by-step guide to building your first MCP server using Node.js, covering core concepts, tool design, and upgrading from file storage to MySQL.
Would you be interested in joining LogRocket's developer community?
Join LogRocket’s Content Advisory Board. You’ll help inform the type of content we create and get access to exclusive meetups, social accreditation, and swag.
Sign up now