Data is such a crucial part of not just software development, but society in general. Wherever data resides, and however it’s used, it’s important to display it in a way that helps the audience digest and understand it.

There are many libraries that facilitate data visualization in charts and other forms. billboard.js stands out for its simplicity and ease of use.
In this tutorial, we’ll explore billboard.js and show you how to use it to create beautiful charts in Node.js.
Here’s what we’ll cover:
To follow along with this tutorial, you should have the following:
billboard.js is a powerful, reusable, elegant interface chart library based on D3 v4+. It’s a JavaScript library that allows developers to create a chart instantly to visualize data.
billboard.js gets its name from the Billboard charts, which tabulate the relative weekly popularity of music released in the U.S. and elsewhere.
Developers like using billboard.js because it’s easy to get started with and use. It also supports D3.js V4+ and offers a wide variety of chart options to choose from.
There are various ways to use billboard.js in a project. billboard.js uses D3.js under the hood, so you’ll also need to load D3.js.
The first way to install billboard.js is to download the library (CSS and JavaScript files) from the official billboard.js website and load it into your project:
<!-- Step 1) Load D3.js -->
<script src="https://d3js.org/d3.v5.min.js"></script>

<!-- Step 2) Load billboard.js with style -->
<script src="$YOUR_DOWNLOAD_PATH/billboard.js"></script>

<!-- Load with base style -->
<link rel="stylesheet" href="$YOUR_DOWNLOAD_PATH/billboard.css">
Create a div for your chart to be displayed in:
<div id="chart"></div>
You can also download styles for various chart themes via the official website.
Alternatively, you can install billboard.js using npm:
$ npm install billboard.js # latest
$ npm install billboard.js@next # Release Candidate
If you want to try billboard.js without downloading or installing it, you can use any of the CDN links below to load it in your project:
billboard.js supports a variety of charts. Below are the chart types that are currently available for use, according to the official docs:
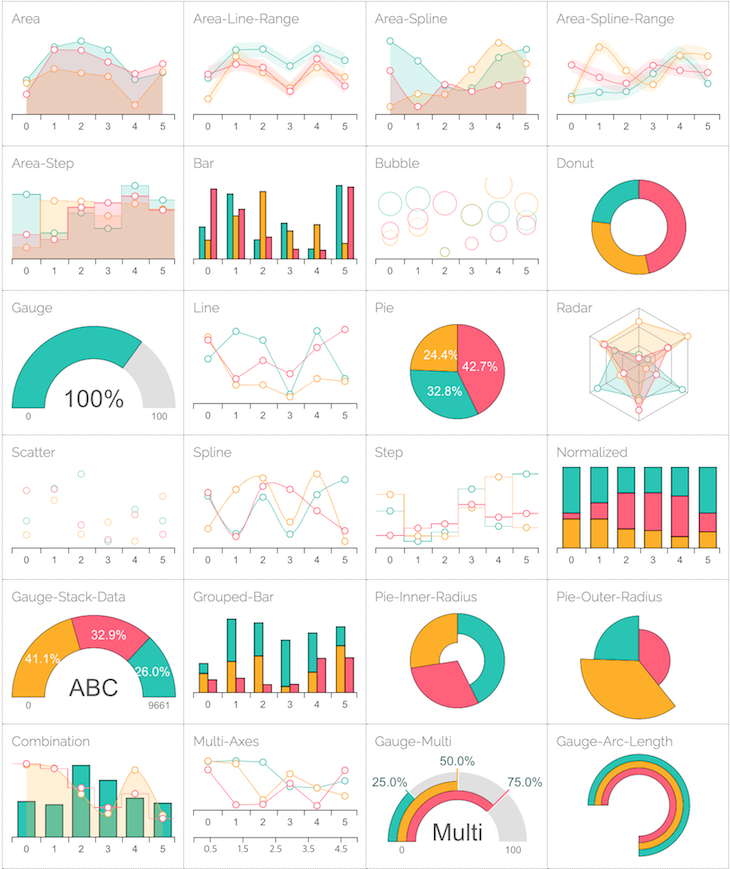
Please note that there are various configuration options available for various chart types, see the examples section of the official billboard.js documentation for more information.
In this section, I’ll demonstrate how to easily create a chart in your project using billboard.js.
First, install billboard.js using any of the methods mentioned above. For this demo, I’ll use the D3.js and billboard.js CDN to use the library and create my chart.
Create a file called chart.html in an empty folder and input the following:
<!--chart.html -->
<!DOCTYPE html>

<title>billboard.js DEMO</title>

<head>
<!-- Load billboard.js css files via cdn -->
<link rel="stylesheet" href="https://cdn.jsdelivr.net/npm/billboard.js/dist/billboard.min.css">

<!--Load D3.js -->
<script src="https://d3js.org/d3.v5.min.js"></script>

<!-- Load billboard.js via cdn -->
<script src="https://cdn.jsdelivr.net/npm/billboard.js/dist/billboard.min.js"></script>
</head>

</html>
The next step is to create a div in the HTML file to display your chart:
<body>
<div id="chart"></div>
</body>
Now create a new file, name it chart.js, and paste in the following:
bb.generate({
    bindto: "#chart",
    data: {
        columns: [
            ["JavaScript", 30, 200, 100, 170, 150, 250],
            ["PHP", 130, 100, 140, 35, 110, 50]
        ],
        types: {
          JavaScript: "area-spline",
          PHP: "step"
        },
        colors: {
          JavaScript: "blue",
          PHP: "green"
        }
    }
});
Let’s break down what’s going on in the code snippet above.
bb.generate({})
This function generates the chart with the parameters you specify inside it.
bb.generate({
    bindto: "#chart"
})
The bindto property holds the ID of the div we created to display our chart in. This enables you to easily target specific HTML elements without having to manipulate the DOM manually.
bb.generate({
    bindto: "#chart",
    data: {
        columns: [
            ["JavaScript", 30, 200, 100, 170, 150, 250],
            ["PHP", 130, 100, 140, 35, 110, 50]
        ],
        types: {
          JavaScript: "area-spline",
          PHP: "step"
        },
        colors: {
          JavaScript: "blue",
          PHP: "green"
        }
    }
});
data property holds an object that contains all the data you need to display in your chartcolumns holds an array containing the values of the data you want to display and the name of the datatypes holds an object containing the type of chart you with which want to display your data. In our case, for JavaScript, we use the “line” chart type and for PHP we used the “step” chart type. You can use any of the supported chart types I showed abovecolors property holds an object containing the type of color you want your data to be displayed inIn your chart.html file, inject chart.js:
<body>
<div id="chart"></div>
<script src="YOUR_PROJECT_PATH/chart.js"></script>
</body>
You should see the following chart displayed in your browser when you open the chart.html file:
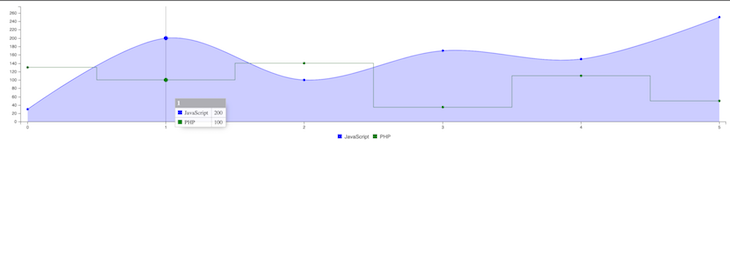
We just created a chart to display data quickly and very easily. There are plenty of other ways to create charts with billboard.js, such as in categories, etc. (more on that in a bit). billboard.js also has various themes for charts that you frequently use by loading the CSS file for whatever theme you want into your project.
Displaying data in categories comes in handy when you need to show a wide range of information on a single chart.
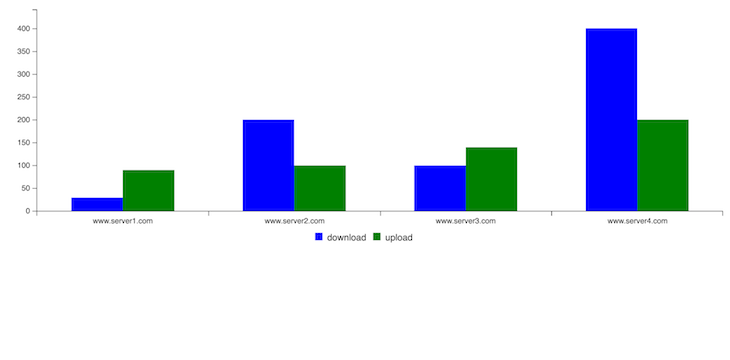
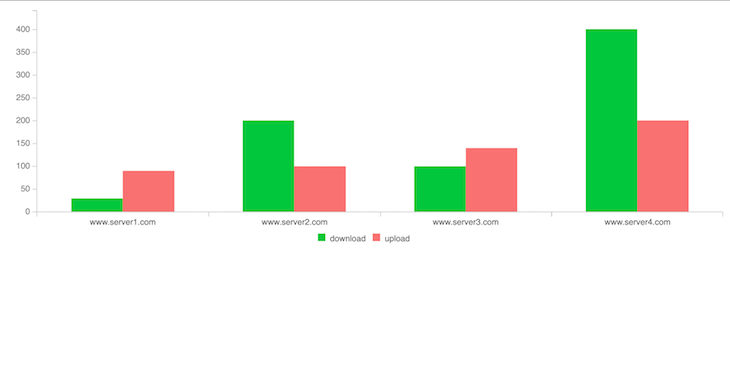
For example, let’s say you have a bunch of servers from which people can download and upload data and you want to display the download and upload values in a single chart. Here’s how to do that with billboard.js:
var chart = bb.generate({
  data: {
    x: "x",
    columns: [
        ["x", "www.site1.com", "www.site2.com", "www.site3.com", "www.site4.com"],
        ["download", 30, 200, 100, 400],
        ["upload", 90, 100, 140, 200]
    ],
    groups: [
      [
        "download",
        "loading"
      ]
    ],
        colors: {
          download: "blue",
          upload: "green"
        },
    type: "bar", // for ESM specify as: bar()
  },
  axis: {
    x: {
      type: "category"
    }
  },
  bindto: "#categoryData"
});
Let’s break down the code.
  data: {
    x: "x",
    columns: [
        ["x", "www.server1.com", "www.server2.com", "www.server3.com", "www.server4.com"],
        ["download", 30, 200, 100, 400],
        ["upload", 90, 100, 140, 200]
    ],
Here, we’re basically specifying the axis (the x property). The columns property holds an array containing the values of the data you want to display and the name.
Unlike the previous example, here we have three arrays containing various data related to the chart:
x value because we want the category names to be displayed on the x axisIf you need to pull data from a server with a URL, you can use the following at the top level of the bb.generate() function:
  data: {
    url: "./data/test.csv",
    type: "line", // for ESM specify as: line()
  },
The url should hold the link or path to the data you want to display on the chart:
    groups: [
      [
        "download",
        "loading"
      ]
    ],
        colors: {
          download: "blue",
          upload: "green"
        },
In this section, we’re naming the category groups and their colors — which, in this case, are download and upload.
  axis: {
    x: {
      type: "category"
    }
  },
Here, we’re specifying what data should be on which axis. We’re telling billboard.js that the x axis should hold the category names.
Here’s what our chart looks like:
If you hover on any of the chart bars, a tooltip will display containing the data for that particular category:
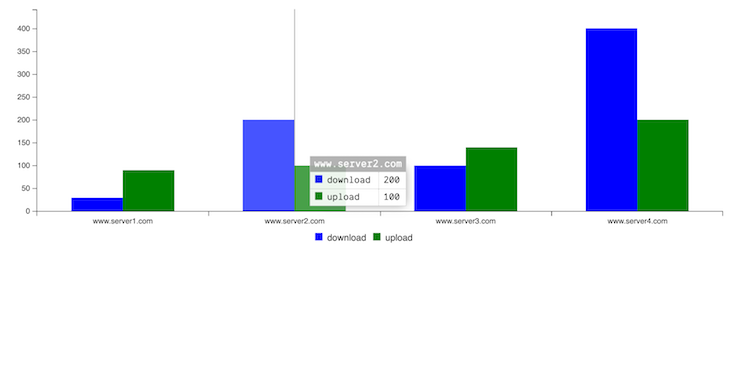
If you don’t want a tooltip to be displayed on hover or at any point, just add the following property inside the bb.generate() function:
tooltip: {
    show: false
  },
There are various themes that are available for use with billboard.js, including:
defaultinsightdatalabgraphYou can use these themes in your project by simply loading a CSS file provided by billboard.js instead of the default CSS file.
For example, here’s the above chart we created using the insight theme:
Add the following to the head tag of your HTML file to use the insight theme:
<link rel="stylesheet" href="
https://naver.github.io/billboard.js/release/latest/dist/theme/insight.css">
If you prefer to use JavaScript to import the theme, or if you installed billboard.js with npm, just add the following to the top level of your JavaScript file and you’re good to go:
// base css
import "billboard.js/dist/theme/insight.css";
In this tutorial, we learned what billboard.js is, reviewed its features, and demonstrated how to create a simple chart. We also learned how to use the chart library to display data in categories and, finally, how to use themes in billboard.js.
 Monitor failed and slow network requests in production
Deploying a Node-based web app or website is the easy part. Making sure your Node instance continues to serve resources to your app is where things get tougher. If you’re interested in ensuring requests to the backend or third-party services are successful, try LogRocket.
LogRocket lets you replay user sessions, eliminating guesswork around why bugs happen by showing exactly what users experienced. It captures console logs, errors, network requests, and pixel-perfect DOM recordings — compatible with all frameworks.
LogRocket's Galileo AI watches sessions for you, instantly identifying and explaining user struggles with automated monitoring of your entire product experience.
LogRocket instruments your app to record baseline performance timings such as page load time, time to first byte, slow network requests, and also logs Redux, NgRx, and Vuex actions/state. Start monitoring for free.
Would you be interested in joining LogRocket's developer community?
Join LogRocket’s Content Advisory Board. You’ll help inform the type of content we create and get access to exclusive meetups, social accreditation, and swag.
Sign up now
Not sure if low-code is right for your next project? This guide breaks down when to use it, when to avoid it, and how to make the right call.

Compare Firebase Studio, Lovable, and Replit for AI-powered app building. Find the best tool for your project needs.

Discover how to use Gemini CLI, Google’s new open-source AI agent that brings Gemini directly to your terminal.

This article explores several proven patterns for writing safer, cleaner, and more readable code in React and TypeScript.