Chrome has integrated AI-powered features to improve the debugging experience in web development. These features leverage the Google Gemini AI model to assist developers in debugging their code without stepping out of the browser environment.
Gemini offers many useful features, including an AI assistance panel, an intelligent coding companion, console insight that provides AI-generated explanations for console errors and warnings directly in the console, and an “Ask AI” feature that is now extended to the sources, network, and performance panels for deep insights to performance metrics and network requests.
This article aims to explore these features with practical examples, showing how developers can leverage them for tasks like performance analysis, UI debugging, and accessibility improvements.
Before moving forward with this tutorial, you should have:
The Gemini AI Assistant Panel supports chatting with the Gemini AI model directly in Chrome DevTools. The context of your chats with Gemini AI is based on the source code of the page visited.
AI assistance is extended to the Element and Styles panels to solve styling and DOM tree challenges, the Network panel to debug network requests, the Sources panel for debugging and exploring the source code, and the Performance panel for debugging performance profiles.
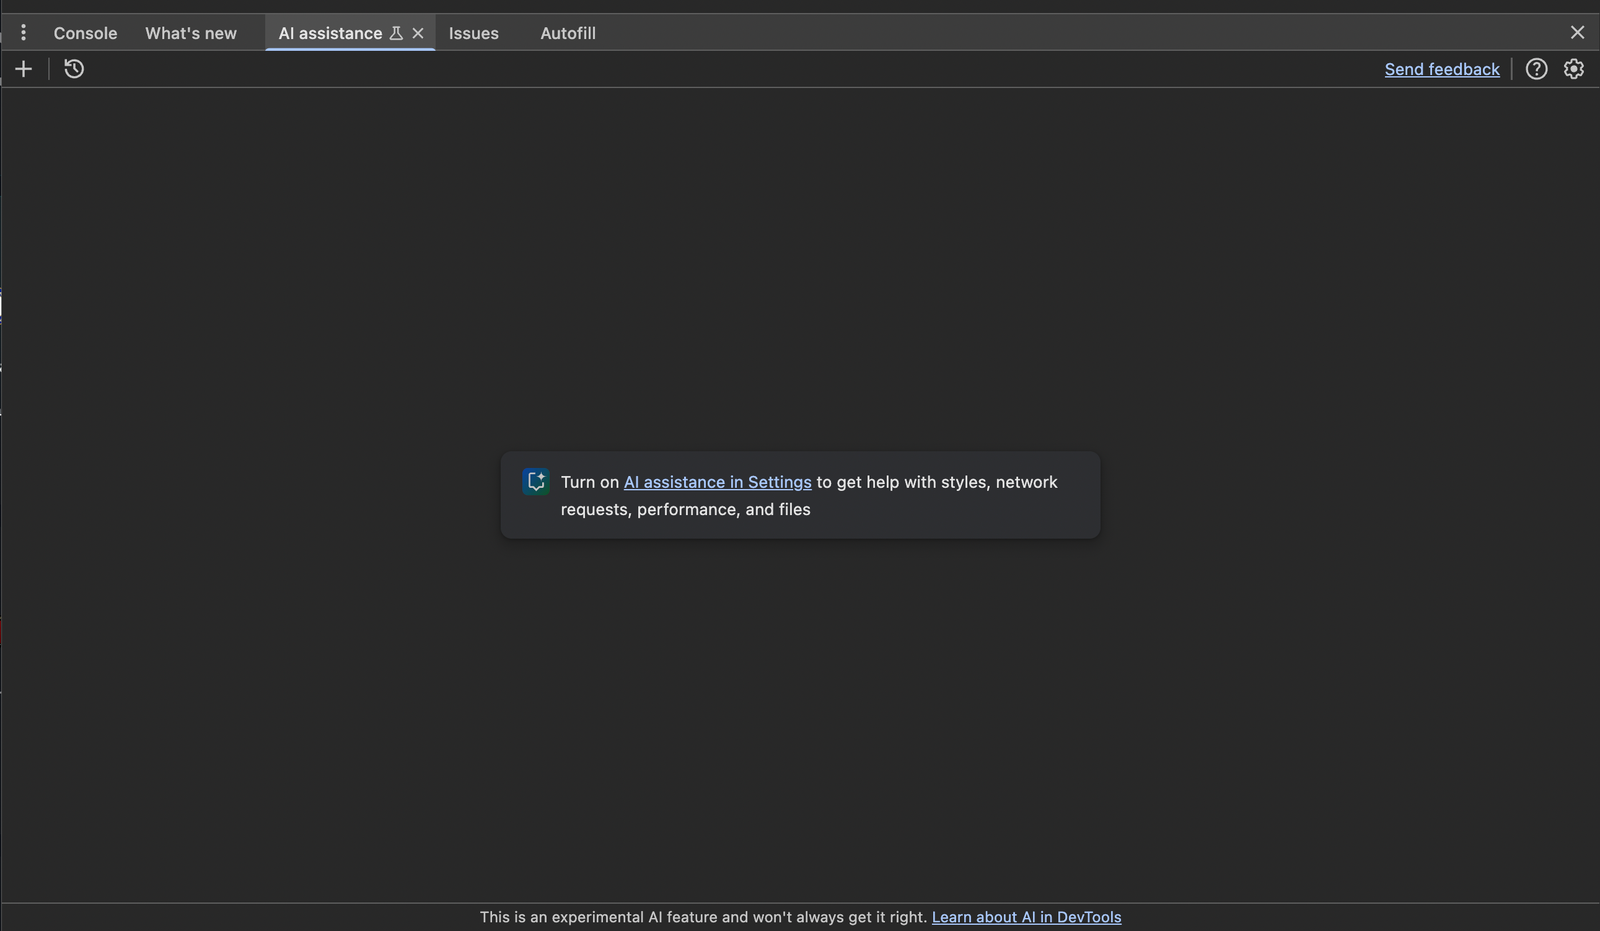
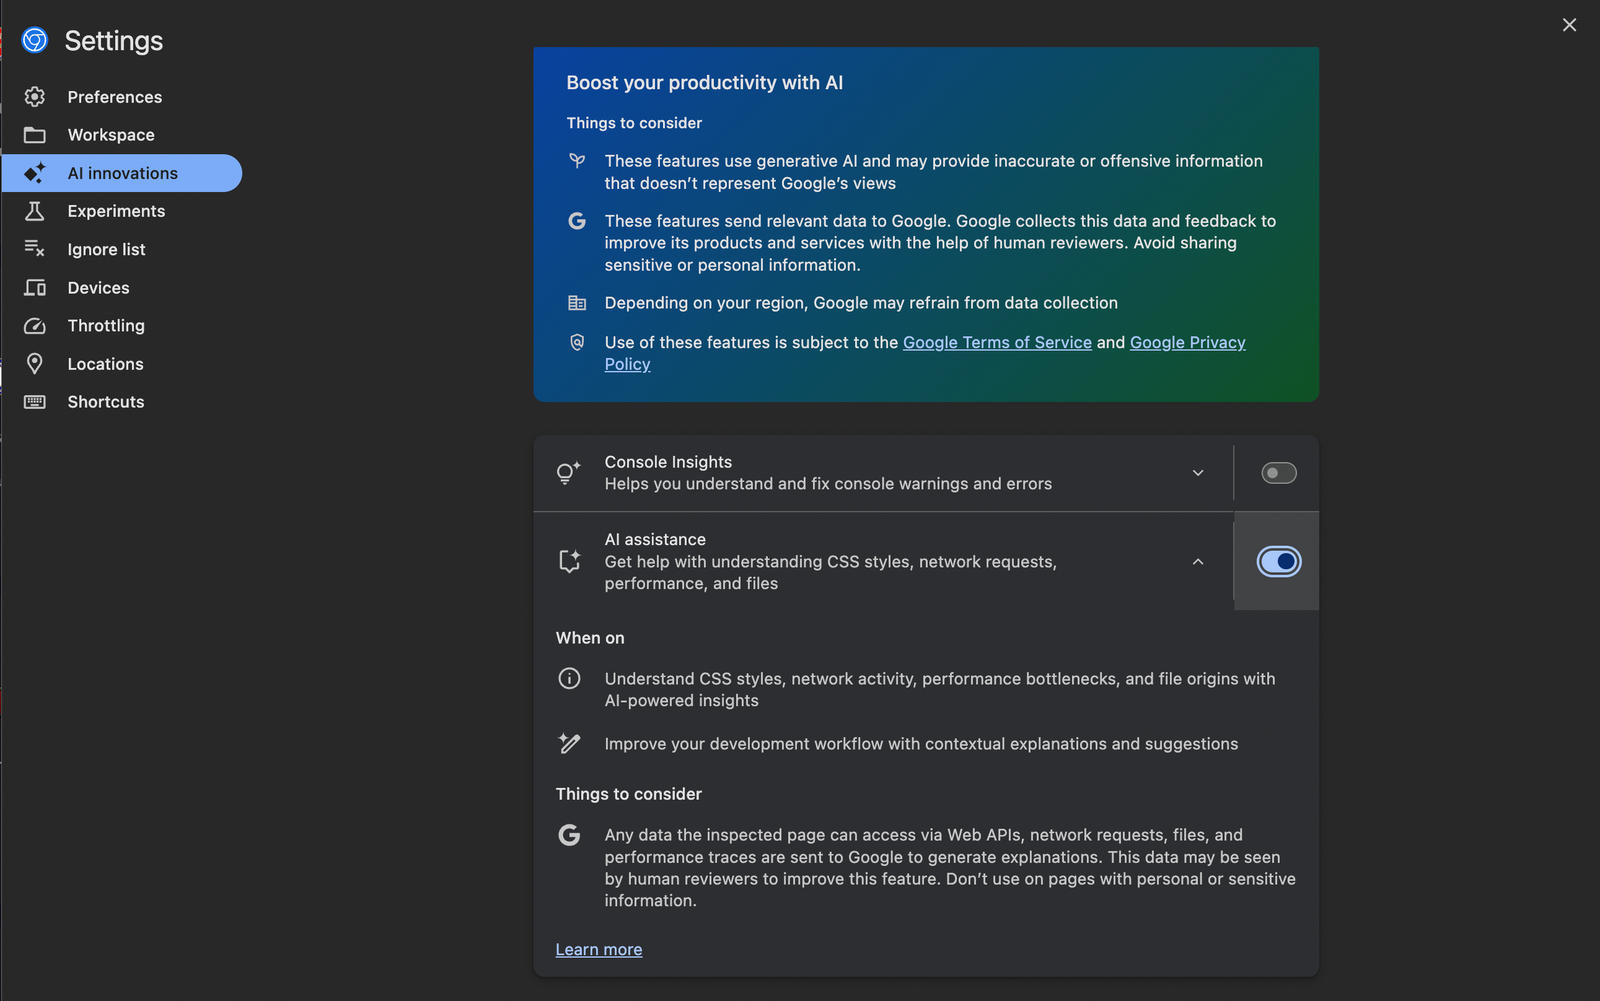
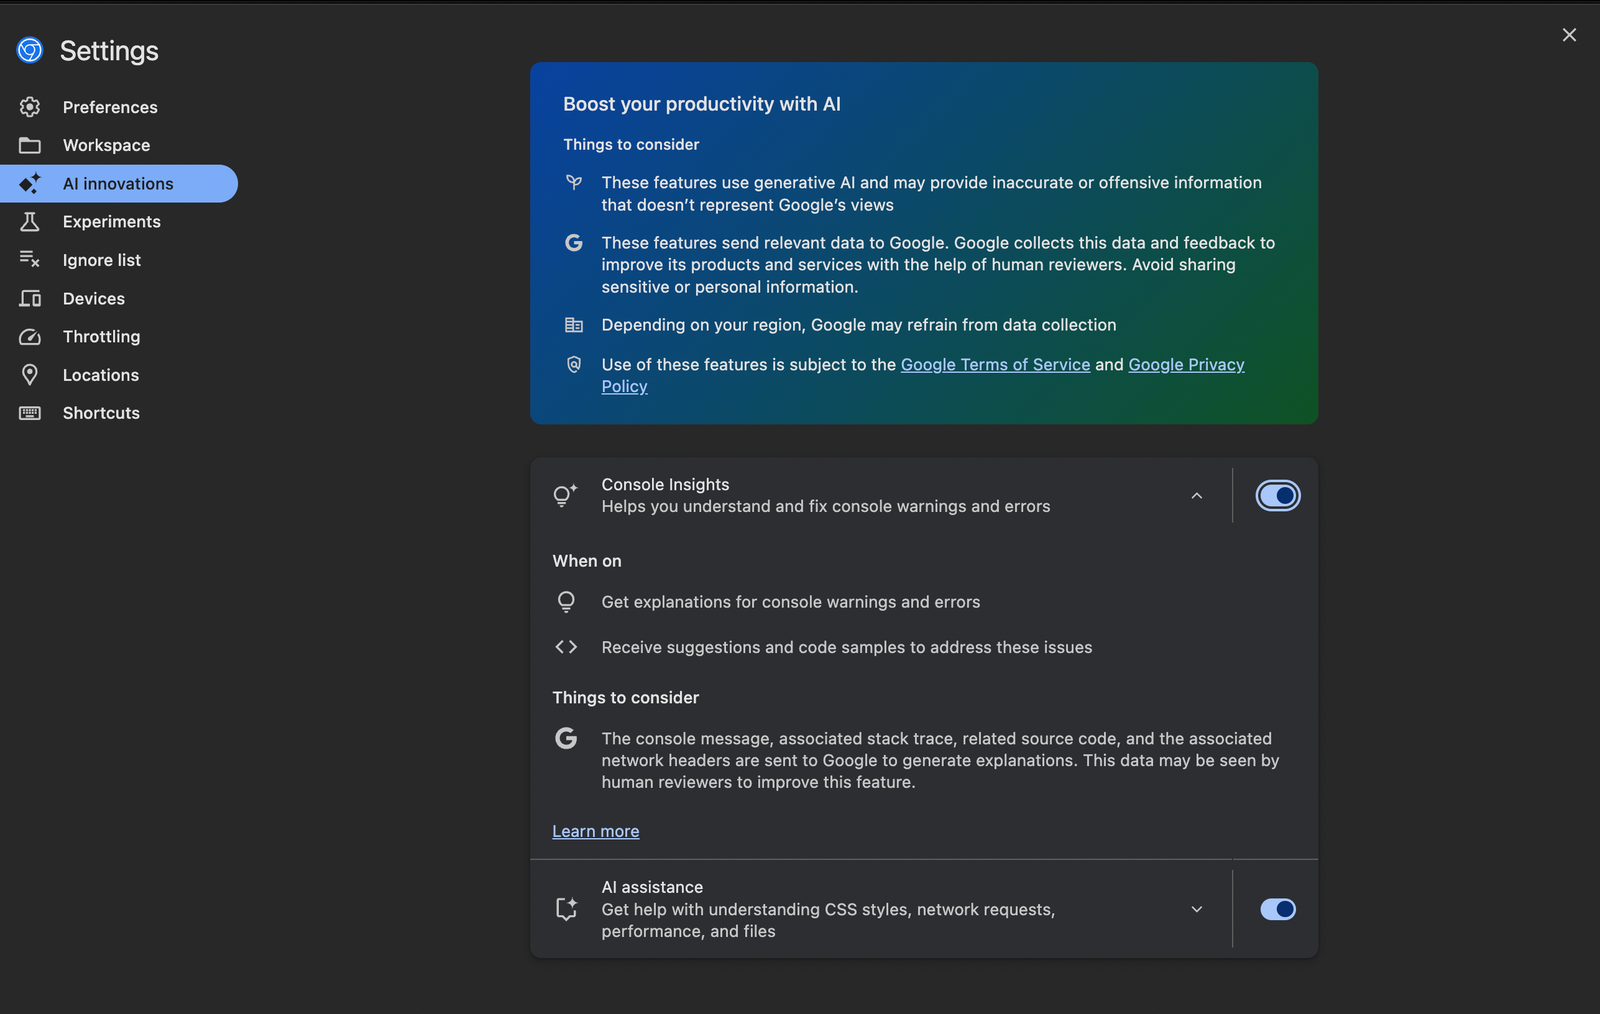
To access the AI Assistant Panel, you need to download the latest Chrome browser version. Once your browser is installed, ensure the following:
Consider our React demo app with two noticeable bugs, even though they don’t break the app:
We’ll use the AI Assistance Panel to fix these bugs.
For the card overlap issue, select the search input element and prompt the AI with the following:
Place input field on top of the cards on scroll
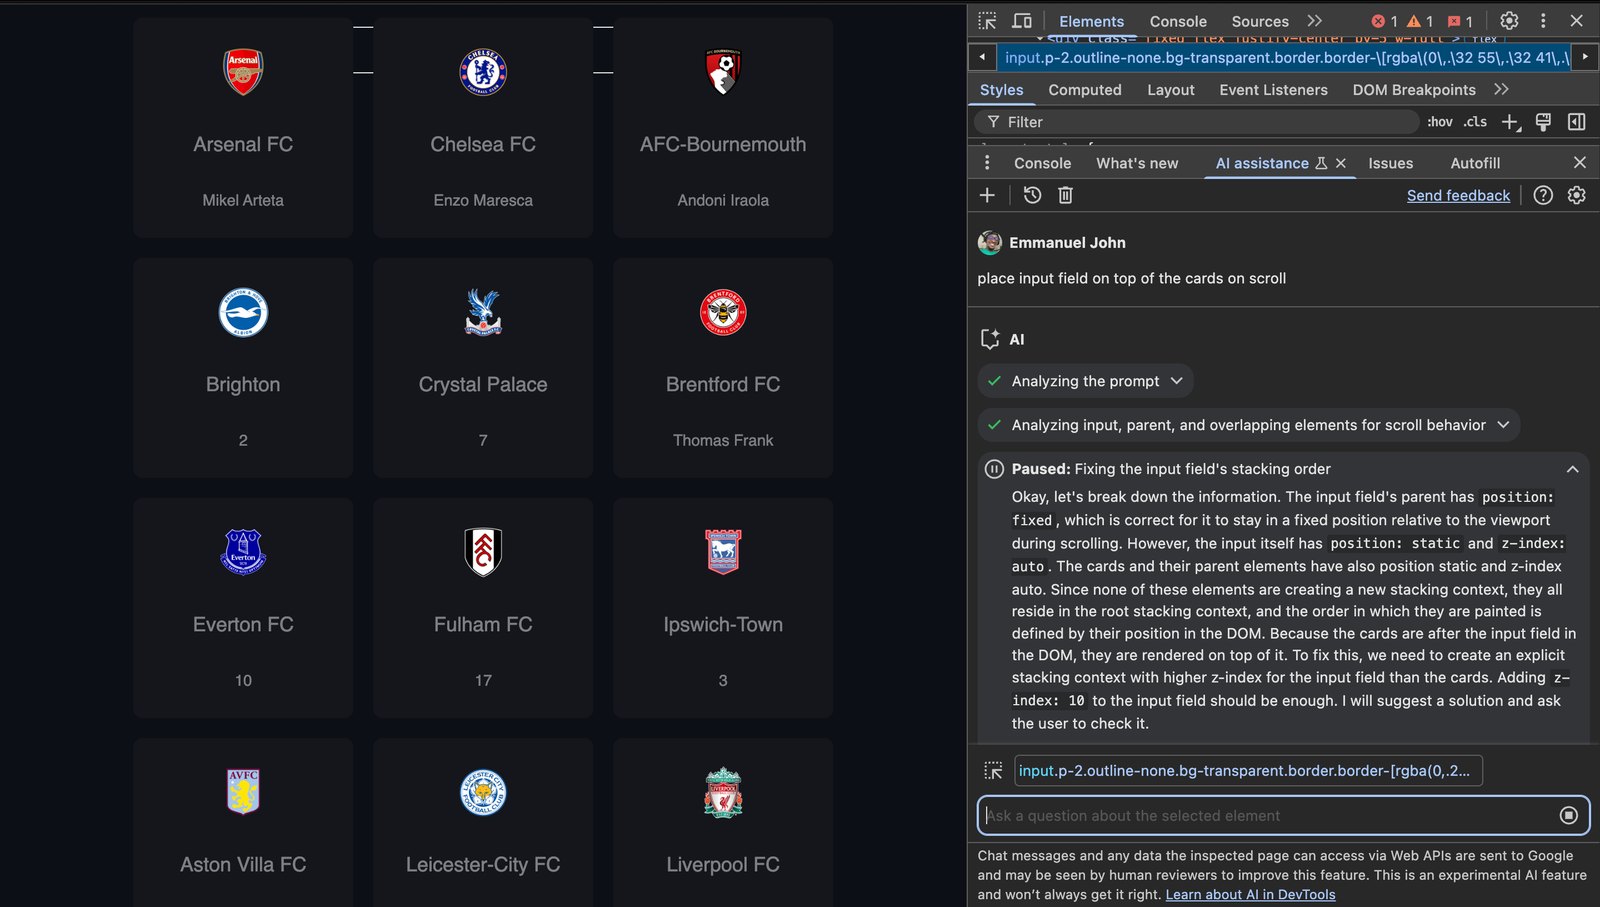
Gemini AI suggests adding z-index: 10 to the input field to fix this issue.
Because Tailwind CSS is used for styling, add z-10 to the input field as follows:
<div className="fixed flex justify-center py-5 w-full">
  <input
    type="text"
    placeholder="Search for a team"
    value={searchTerm}
    onChange={(e) => setSearchTerm(e.target.value)}
    className="p-2 z-10 outline-none bg-transparent border border-[rgba(0, 255, 241, 0.4)] w-full md:w-[600px] text-gray-400 rounded"
  />
</div>
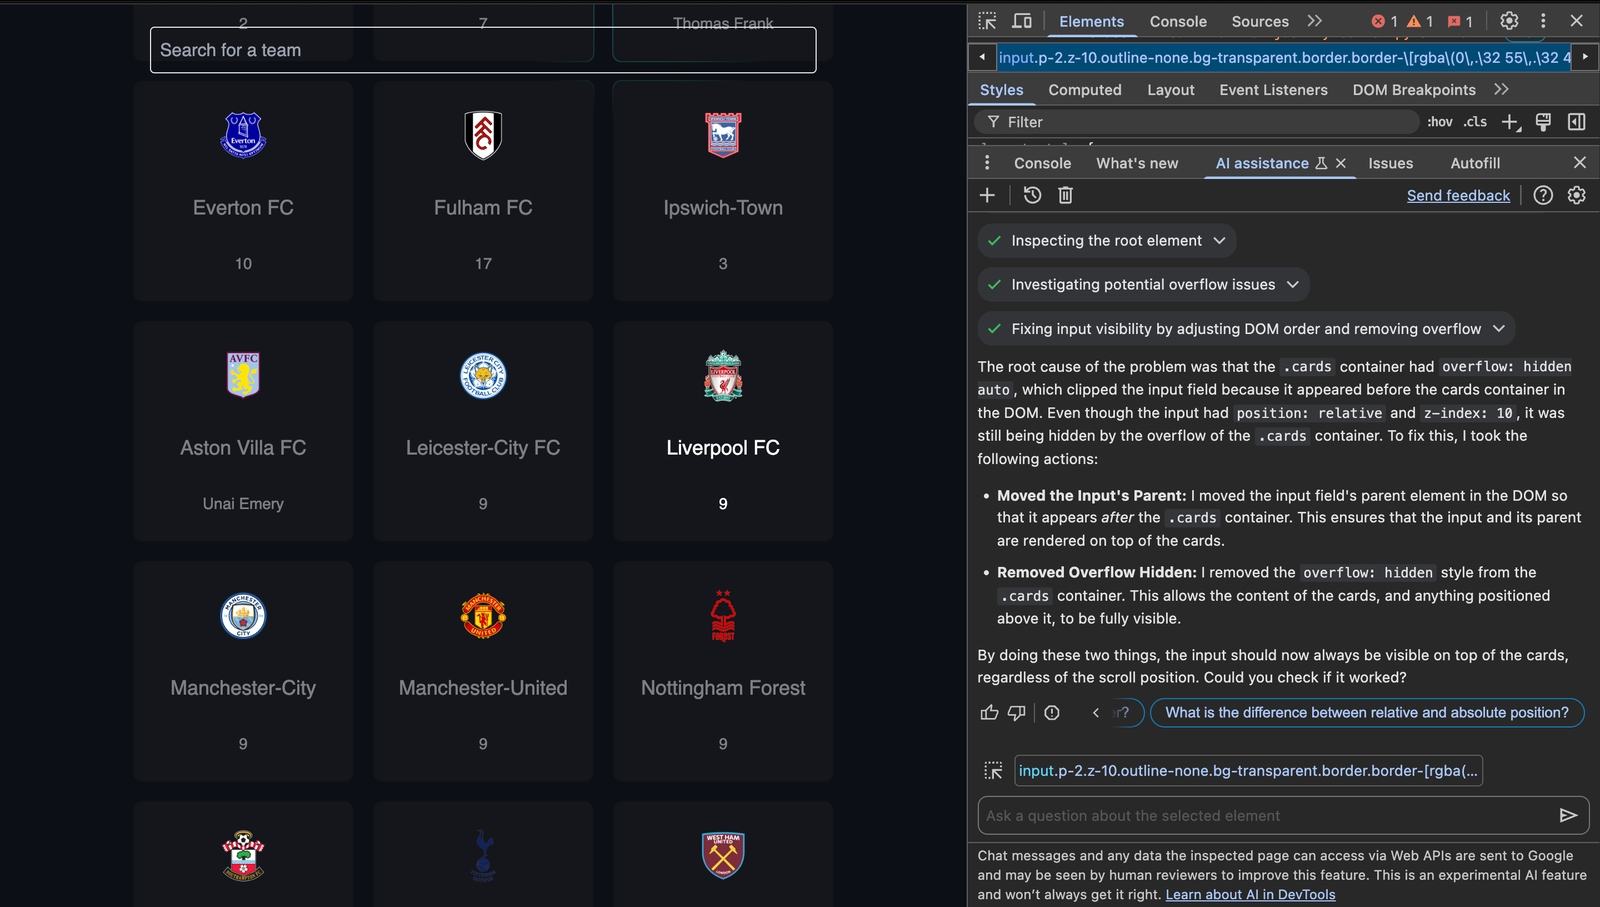
If you run the app now, you’ll notice that the bug is still not fixed. The good thing is that the suggestion from Gemini is accurate, but then we need to apply our understanding of CSS to completely resolve the issue.
With our understanding of CSS’s stacking context, the parent div‘s position being fixed makes it sit behind other components. So the z-10 should be in the parent component to make it sit above other components:
<div className="fixed z-10 flex justify-center py-5 w-full">
  <input
    type="text"
    placeholder="Search for a team"
    value={searchTerm}
    onChange={(e) => setSearchTerm(e.target.value)}
    className="p-2 outline-none bg-transparent border border-[rgba(0, 255, 241, 0.4)] w-full md:w-[600px] text-gray-400 rounded"
  />
</div>
Run the app and you’ll notice that the bug is fixed:
For the search functionality bug, select the search input element and prompt the AI with the following:
The search functionality implemented in React doesn't work as expected. (nothing is displayed when user enters a club name in lowercase )
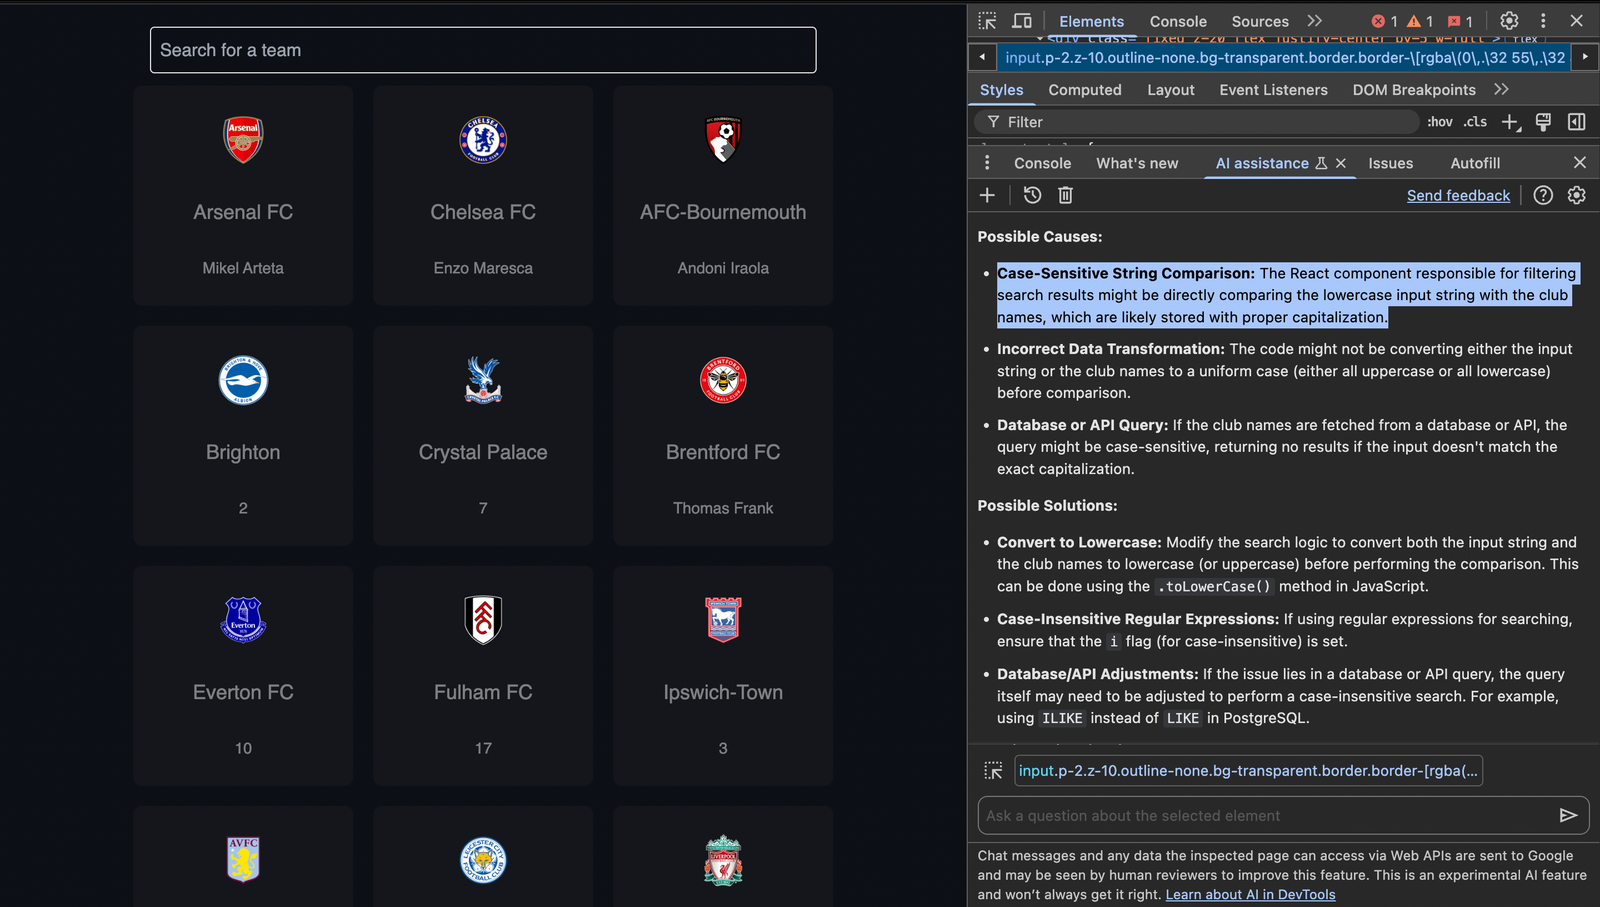
Gemini AI suggests possible causes and their corresponding solutions. Fortunately, applying the first possible cause and solution fixes the search functionality bug.
Here is the cause of the bug:
const filterByName = (teams, searchTerm) => {
  return teams.filter((team) =>
    team.name.includes(searchTerm)
  );
};
Here is the solution:
const filterByName = (teams, searchTerm) => {
  return teams.filter((team) =>
    team.name.toLowerCase().includes(searchTerm.toLowerCase()));
};
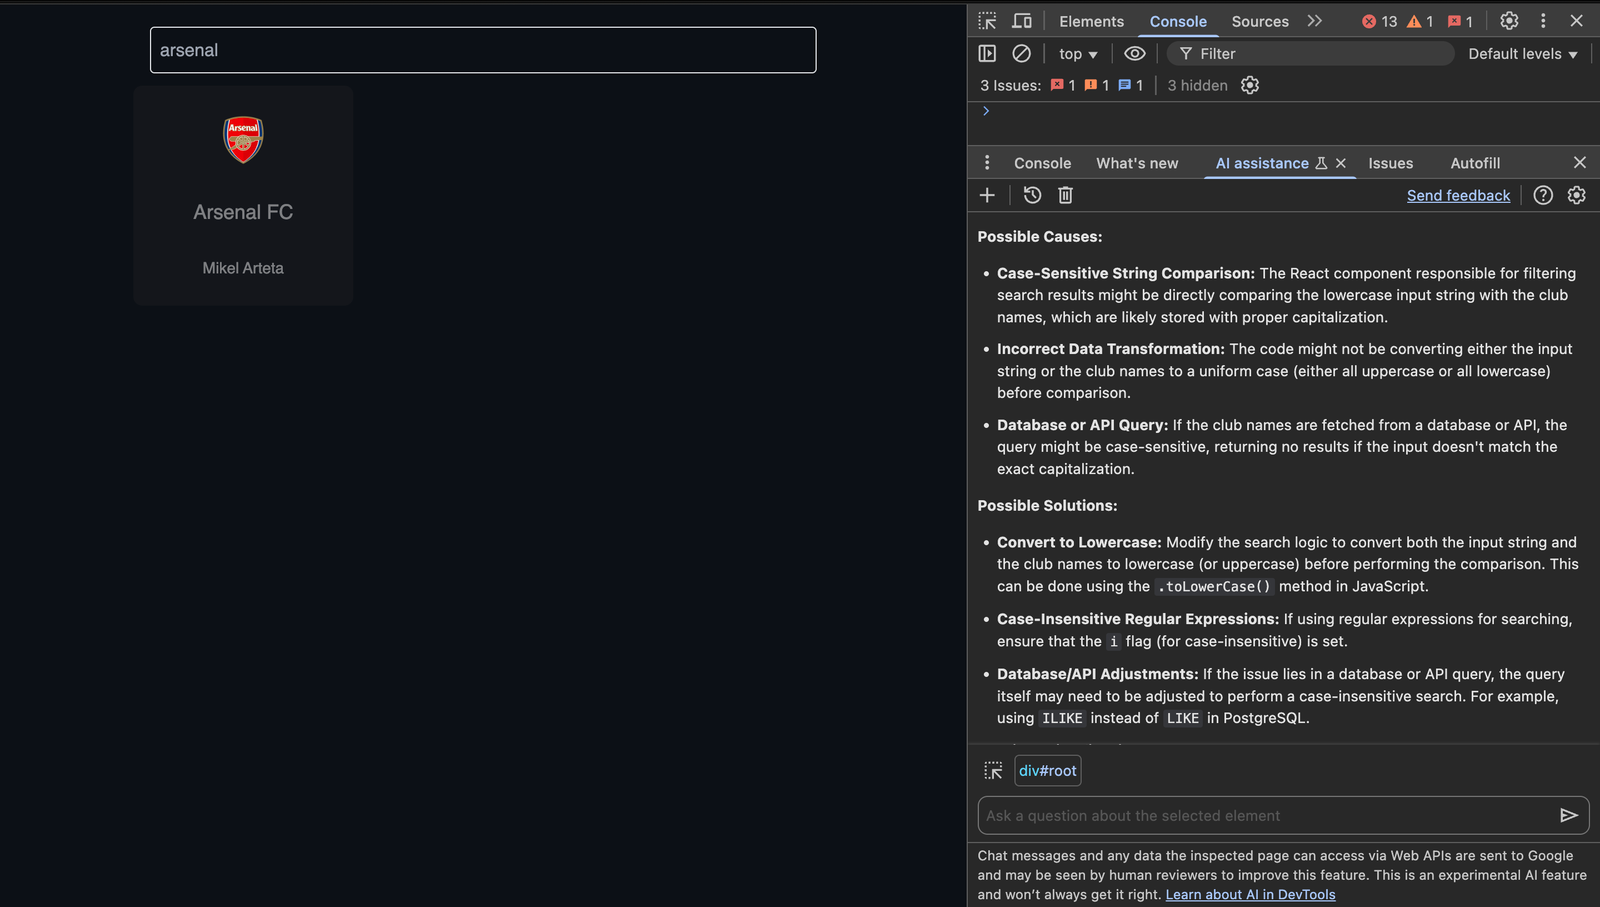
With this solution, our search functionality should work as expected:
The console insight is an AI-powered tool that deciphers and explains console errors by analyzing stack traces and context from the source. With new Gemini support in DevTools, console insight explains the error and suggests fixes you can apply immediately.
Check the browser console of the demo React app, and you’ll see the following error:
index.jsx:72 Warning: Each child in a list should have a unique "key" prop.

Check the render method of `Cards`. See https://reactjs.org/link/warning-keys for more information.
    at div
    at Cards (http://localhost:3000/static/js/bundle.js:317:86)
    at App
[email protected]:72
Hover on the error message, and you’ll see a bulb icon on the right section of the error message. Click the bulb icon, then turn on Console insights in Settings to receive AI assistance for understanding and addressing console warnings and errors:
Now, Gemini AI will explain the error and suggest a fix for the error:
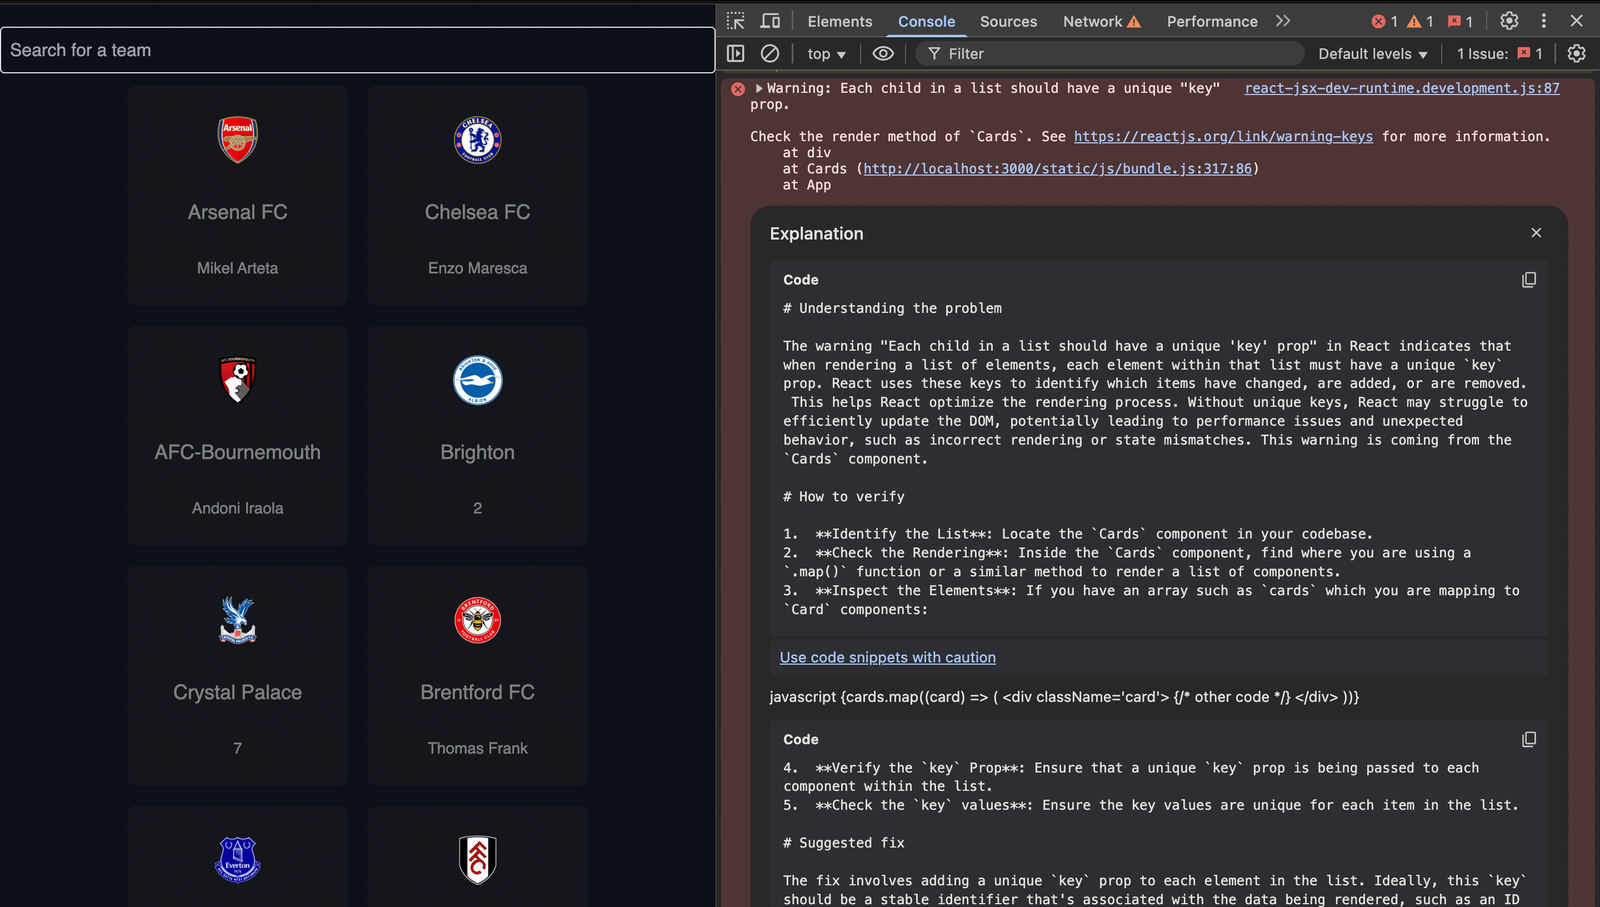
Add a unique key prop to the card component, and the error will be resolved:
{filteredTeams.map((team) => (
  <div key={team.name} className="card relative flex justify-center items-center rounded-lg transition-all duration-150 h-[250px] sm:h-[200px] w-[250px] sm:w-[200px]">
    <div className="card-content flex flex-col justify-center items-center gap-[16px] sm:gap-[26px] bg-[#13161c] rounded-lg transition-all duration-250 h-[calc(100%-2px)] w-[calc(100%-2px)]">
      <img
        className="logo w-[40px] sm:w-[50px]"
        src={`${getImage(team.logo)}`}
        alt={team.name}
      />
      ....
    </div>
  </div>
))}
The network request debugging AI allows you to chat with Gemini AI with the context based on the selected network request list.
Right-click any network request and click the Ask AI option to access the network request debugging AI:
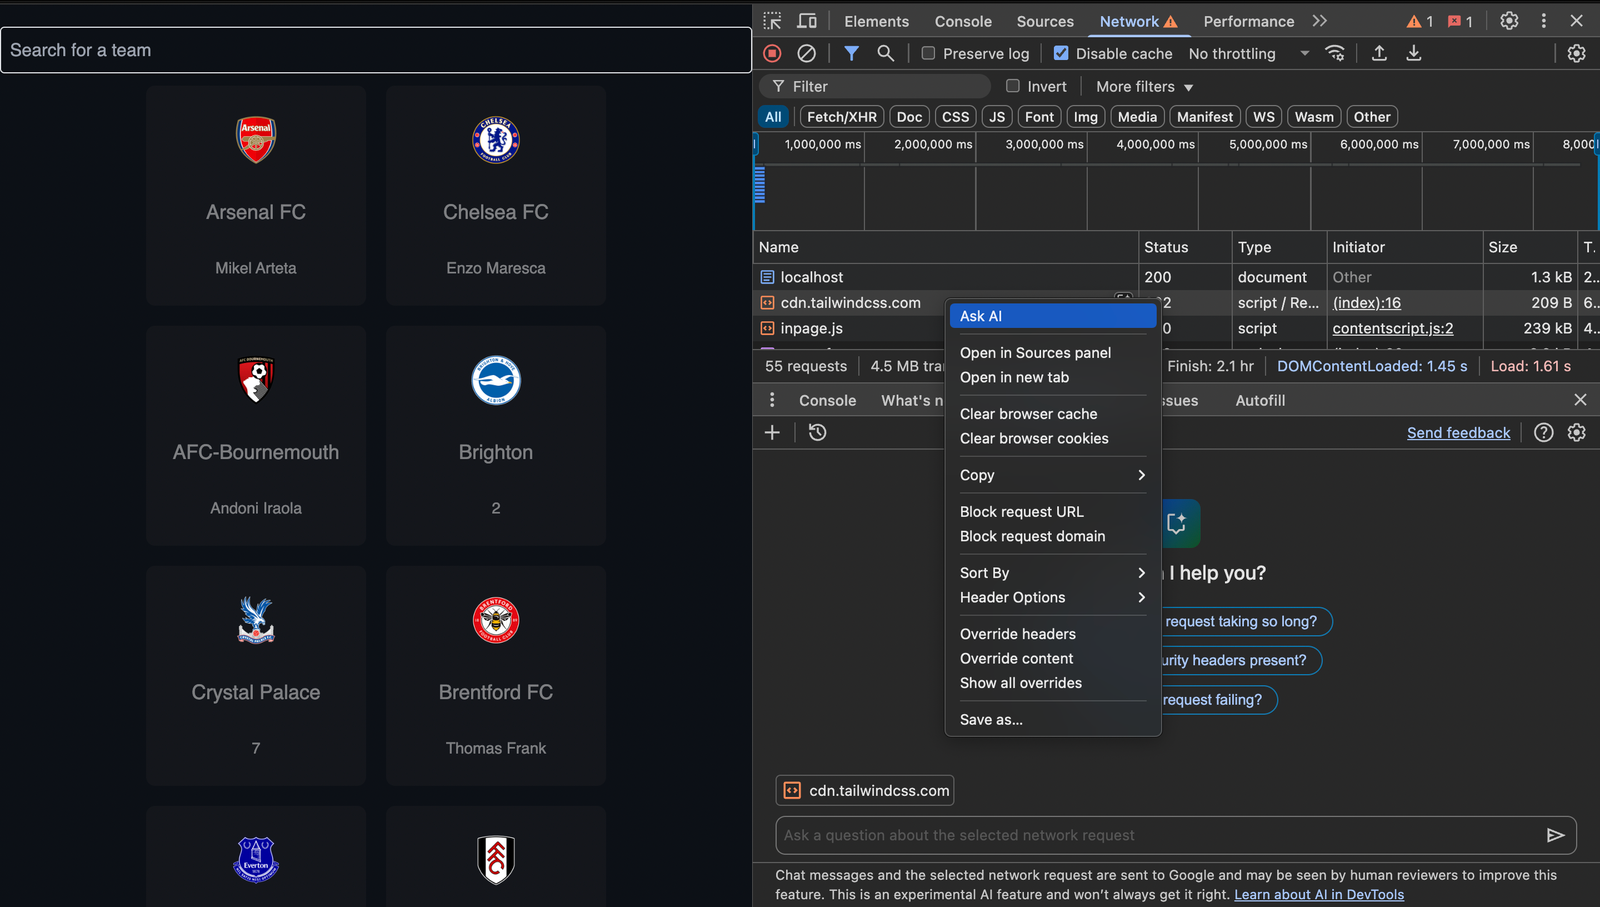
Now, you can chat with the Gemini AI assistant based on the context of the selected network request. You can also change the chat context by selecting another network request.
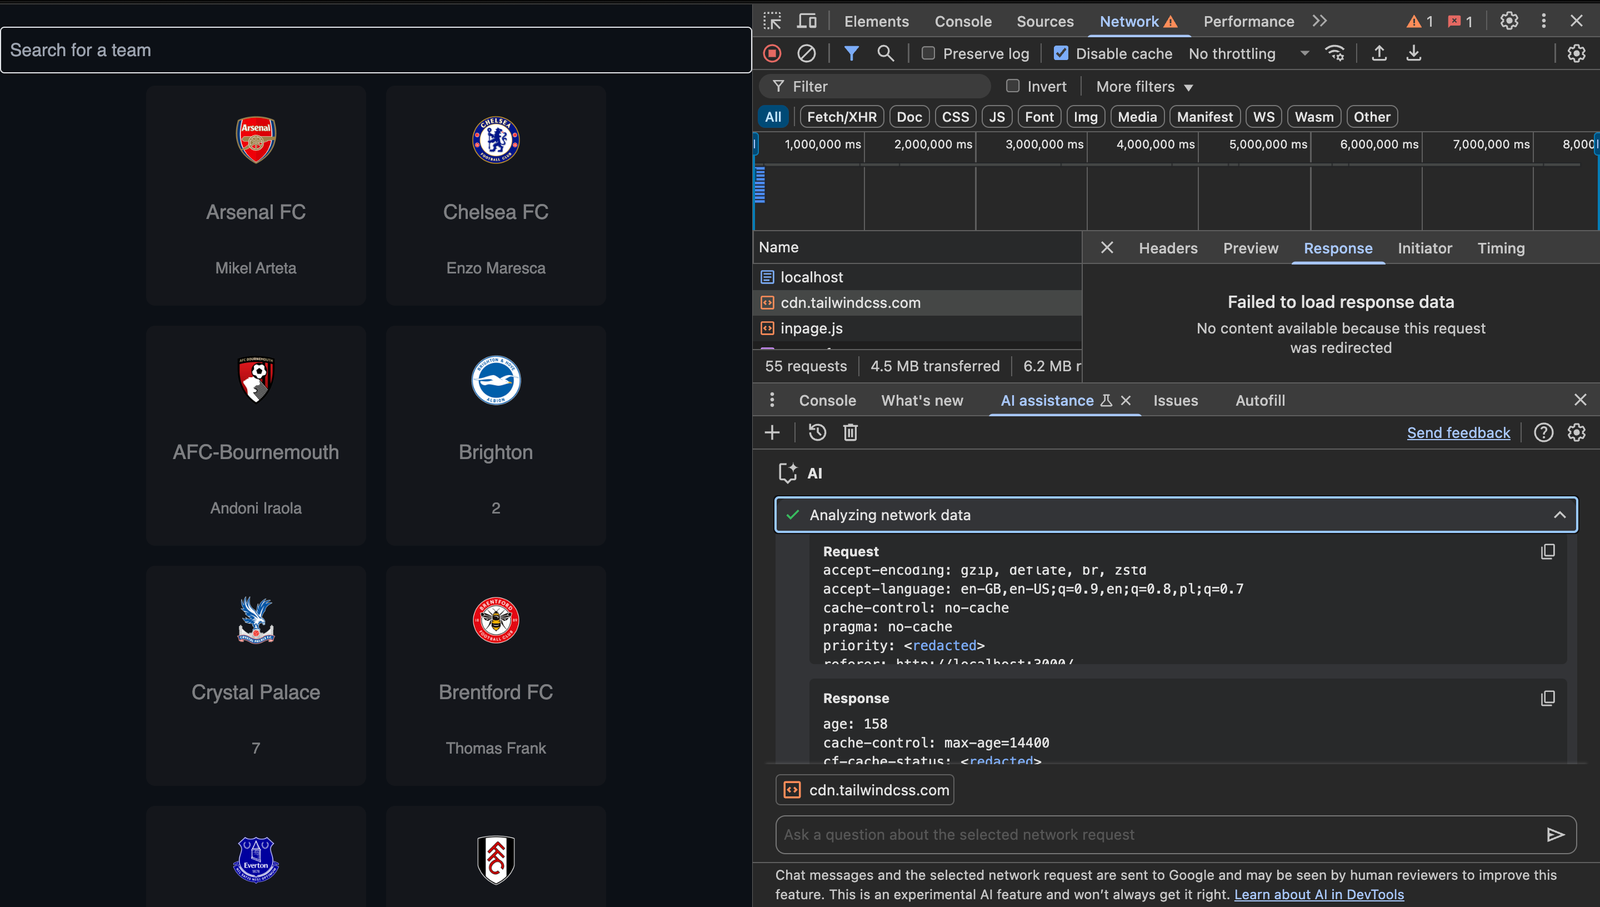
To see the raw data used by Gemini AI to reply to our chat, click the Analyzing network data dropdown:
A great use case for the network request debugging AI is to debug network issues such as timeouts (server takes too long to respond), DNS resolution problems (can’t resolve host), SSL/TLS errors (invalid certificate or HTTPS issues), and rate limiting or throttling (e.g., 429 Too Many Requests).
The initial load speed of our demo app is slow — let’s find out why. Select the request to tailwindcss.com and prompt the AI with the following:
Why is this network request taking so long?
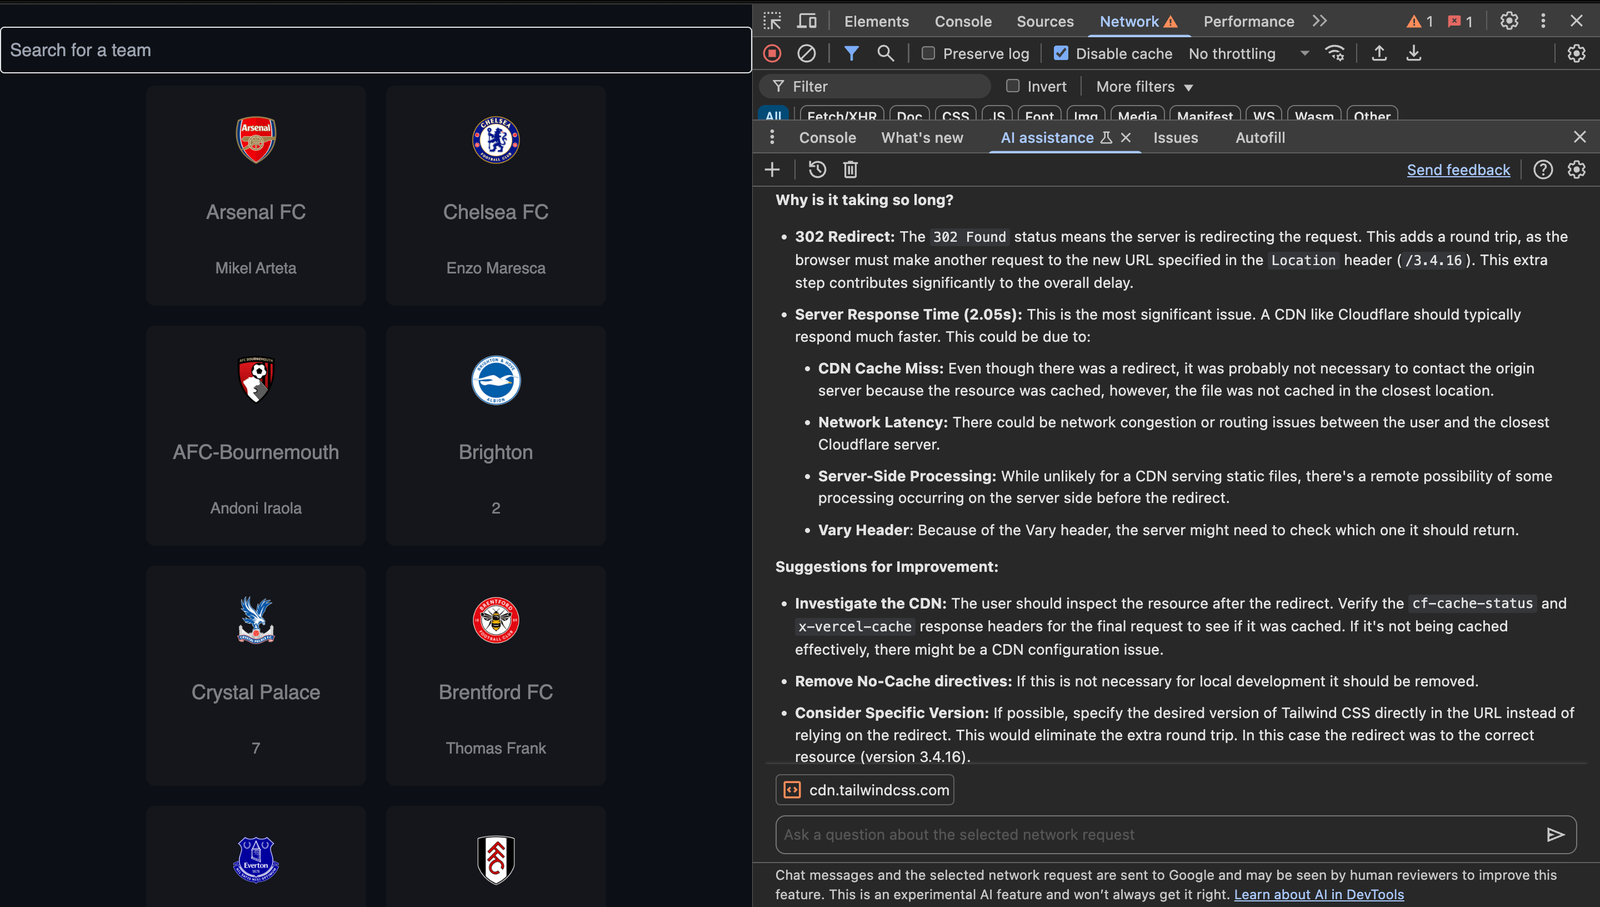
Gemini AI suggests possible causes and suggestions for improvement. Applying these suggestions will improve the initial load time of the app.
The source code AI assistant allows you to chat with Gemini AI with the context based on the selected files in the source panel. With this, you can have an overview of what each file does on your website.
To access the source code AI assistant:
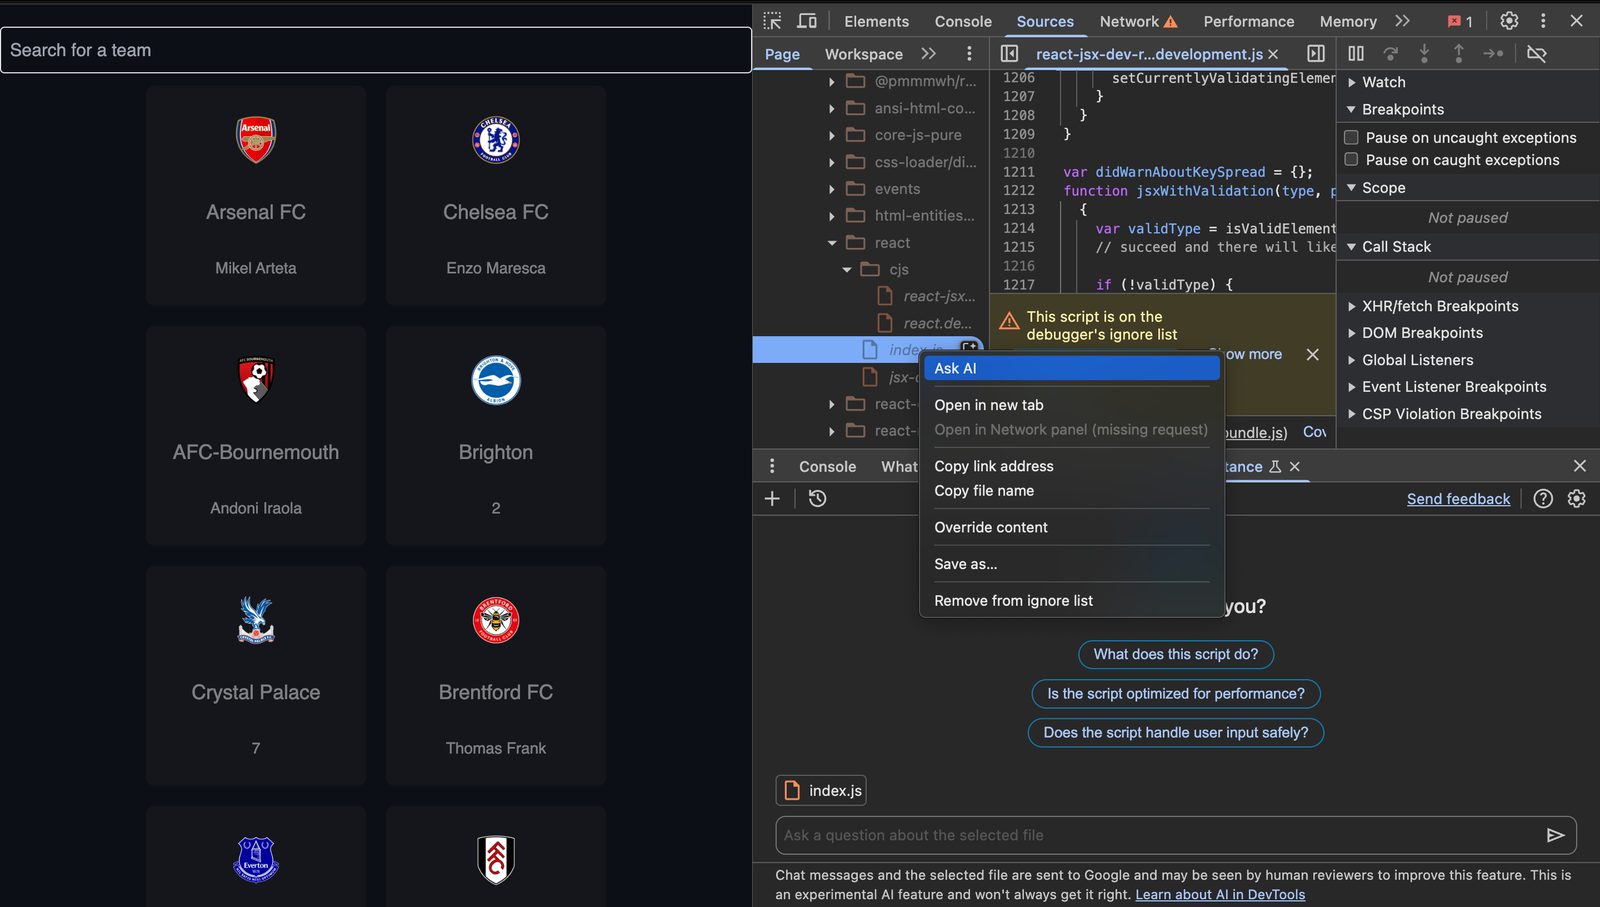
Prompt the AI assistant to get a response within the context of the selected file.
A flame graph in Chrome DevTools visualizes how much CPU time your functions are using. It helps you quickly identify where your app is spending too much time on synchronous operations.
The performance AI assistant pinpoints performance issues and provides suggestions to resolve them based on the flame graph and recorded performance profiles.
To access the performance AI assistant:
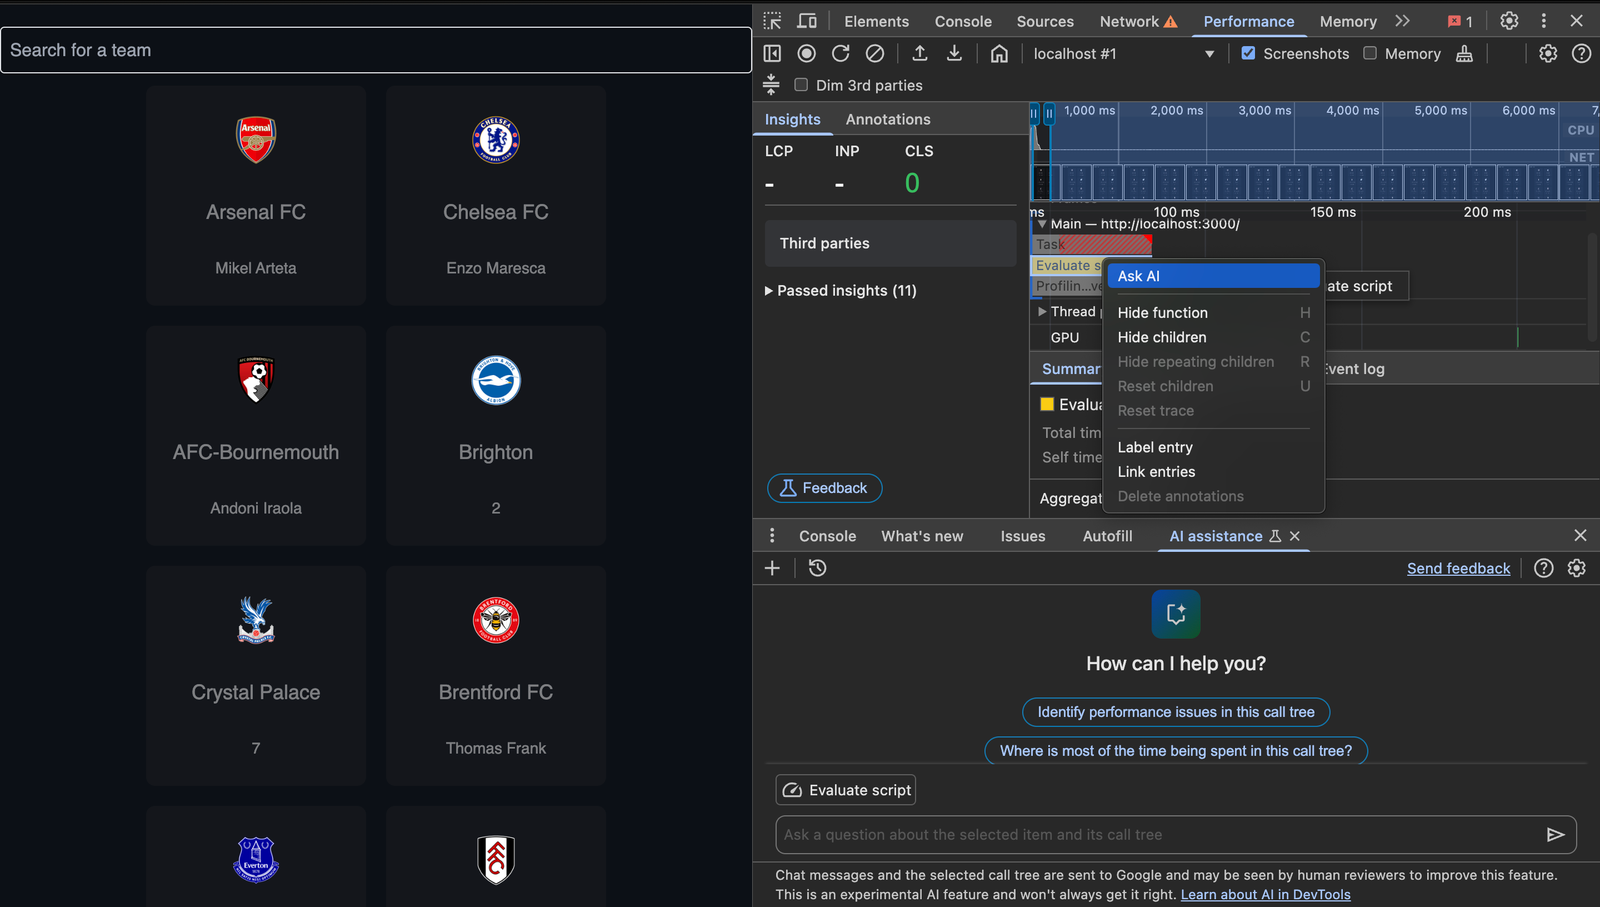
You can enter a custom prompt or select the example prompts.
Now prompt the AI with the following:
Identify performance issues in this call tree
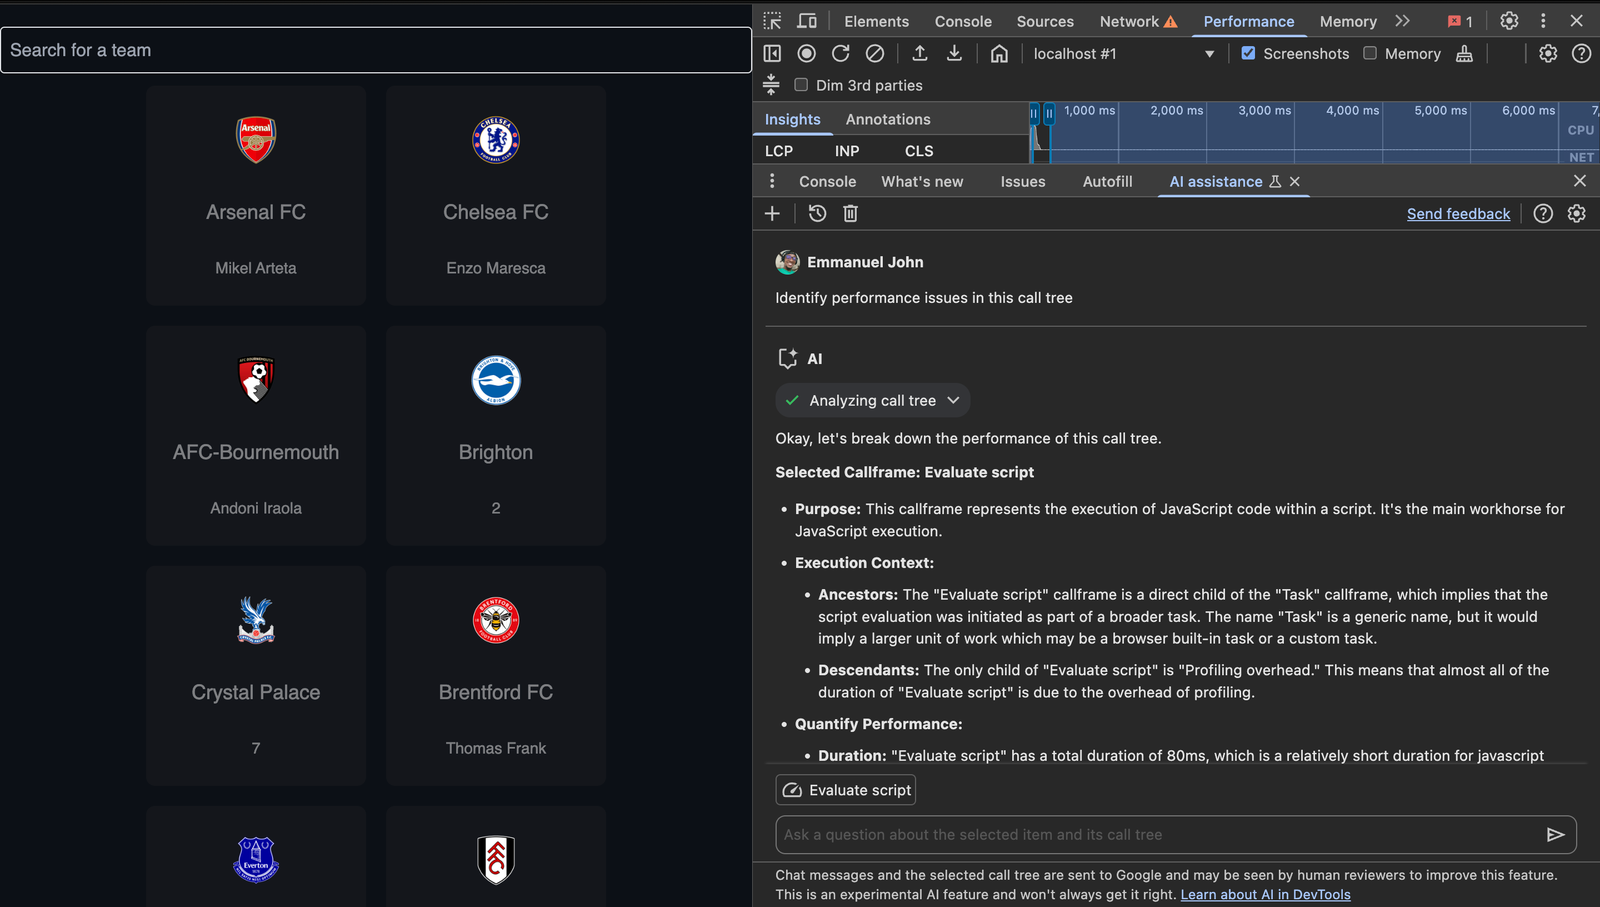
The AI assistant analyzes the call tree for performance issues and provides suggestions to resolve them.
The AI assistant pinpoints performance issues and provides suggestions to resolve them based on the flame graph and recorded performance profiles. This can help identify slow components and functions in our applications.
The AI assistant can also adjust color contrast to meet WCAG AA/AAA accessibility requirements.
Notice the poor color contrast on this page:
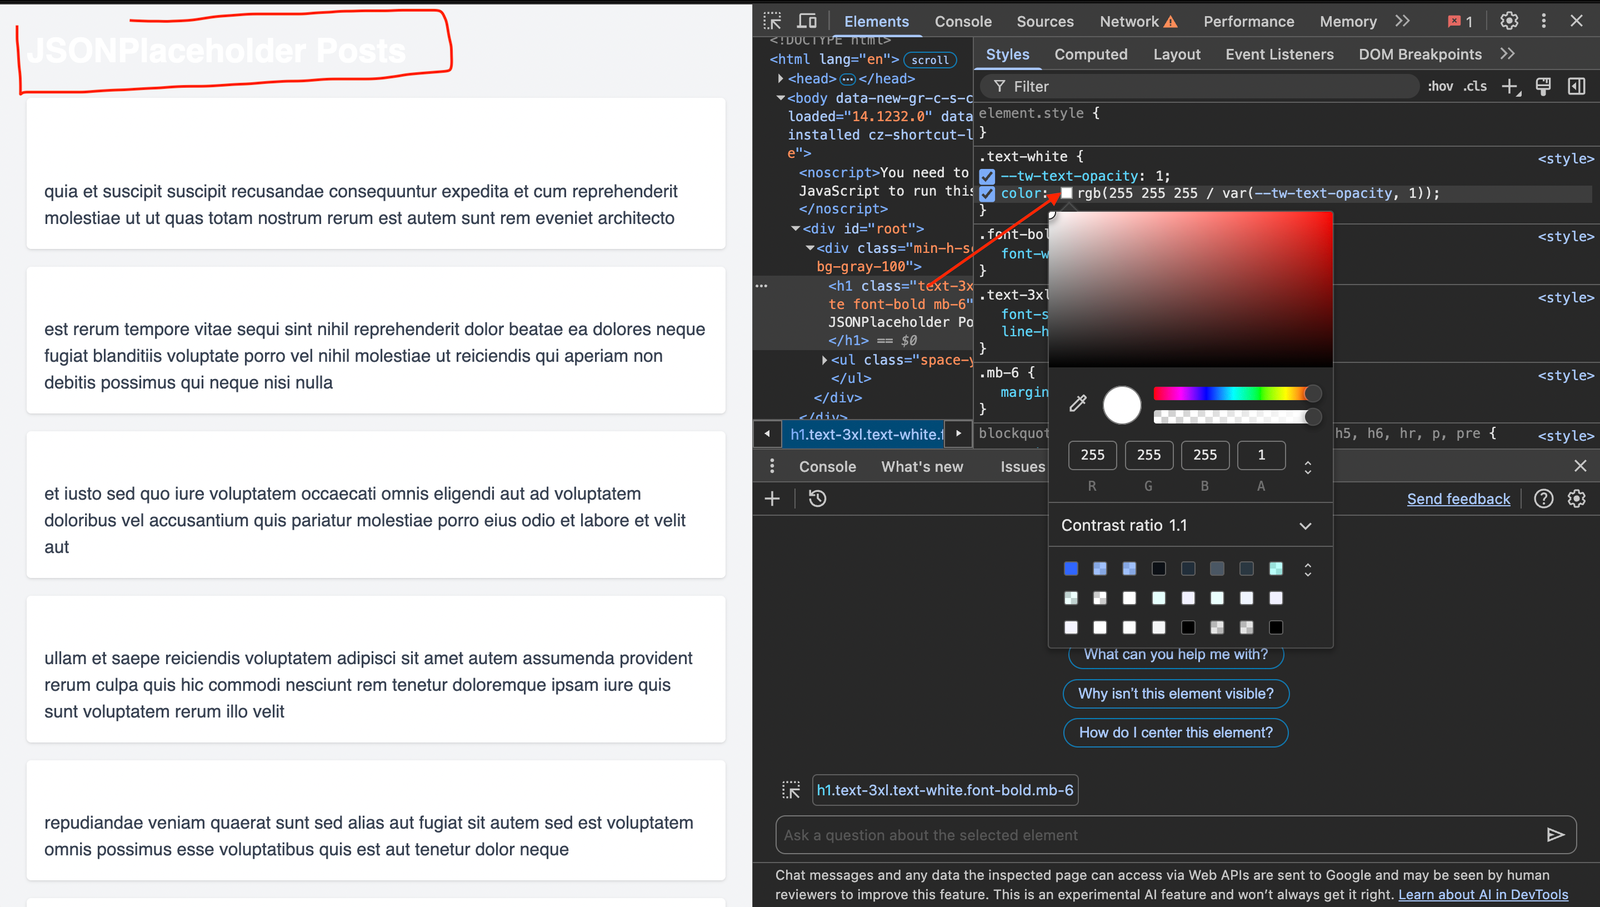
Let’s use the AI assistant to fix this. First, inspect the section or element with poor color contrast. Click the color palette icon, then open the contrast ratio menu to view AI-suggested options for improving the contrast:
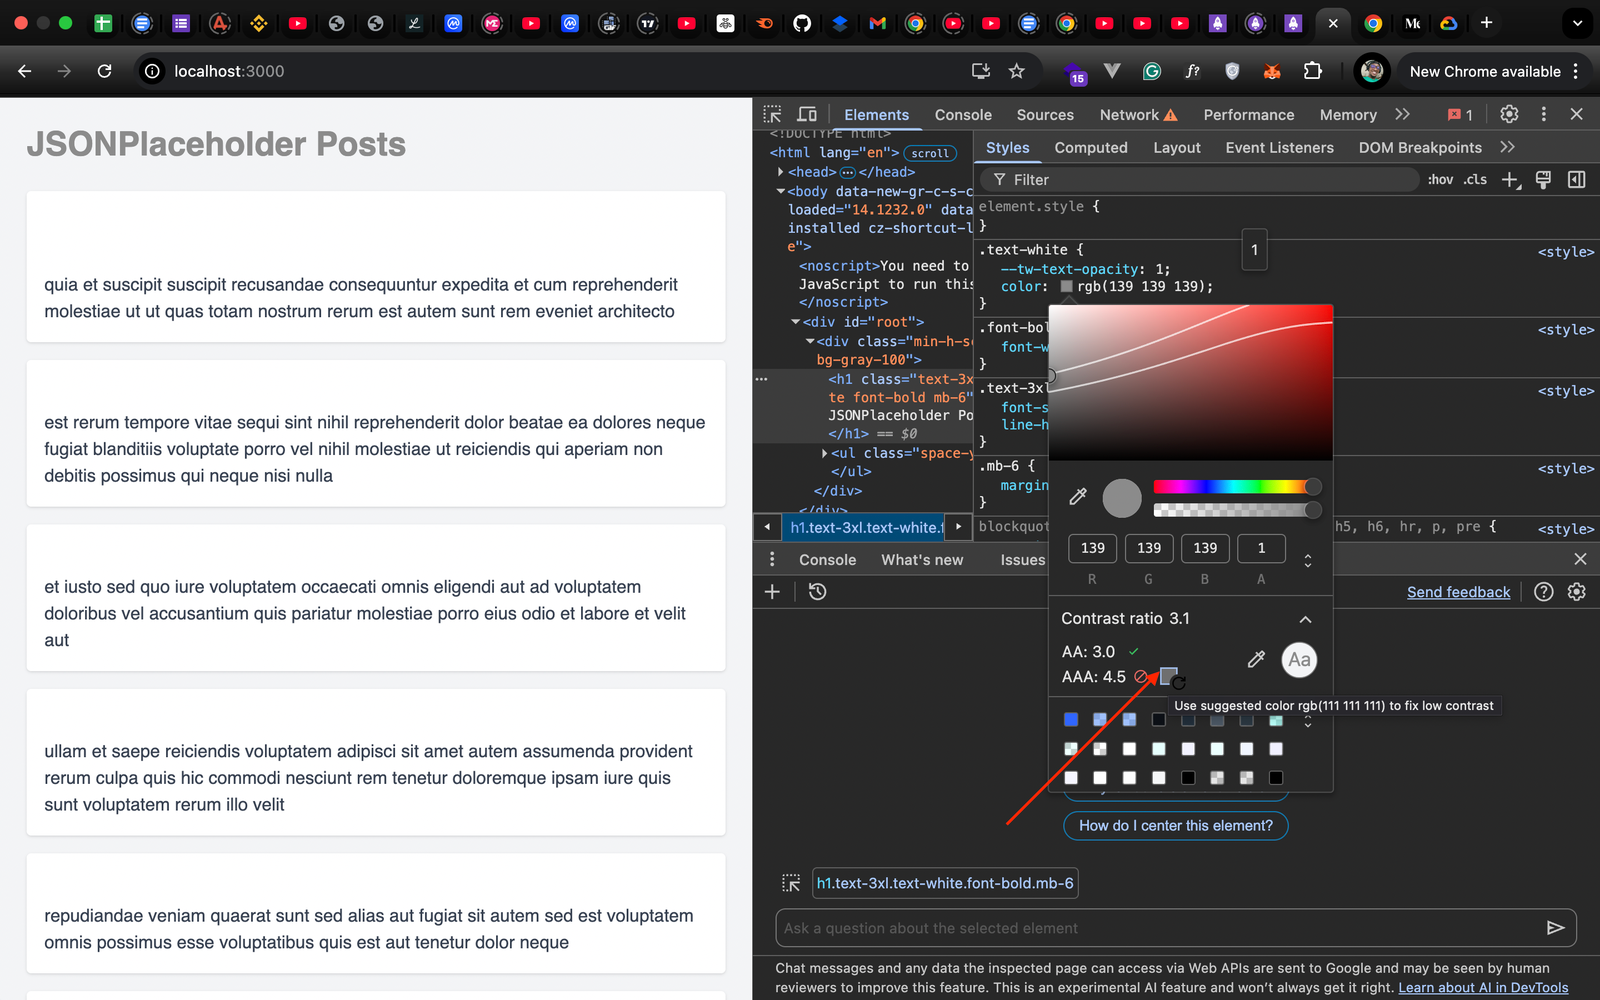
Click the check box in each option to automatically fix the contrast issue.
Google’s recent implementation of the Gemini AI model is a great tool for debugging. In this guide, we offered hands-on practice with the AI assistant panel, color contrast fixer, source code AI assistant, network request debugging AI, console insight, and AI for flame graph analysis. As these features continue to evolve, they‘ll redefine how we build and debug for the web, making development smarter and intuitive.
Keep in mind that these features are experimental and may change or never be included in future Chrome builds.
Discover how React Fiber works under the hood. Learn how React builds the DOM, handles concurrent rendering, and works alongside React 19 features and the new React Compiler.

Learn how to use Skybridge, an open-source React framework, to build and deploy cross-platform AI apps and interactive UI widgets for ChatGPT, Claude, and MCP clients from a single codebase.

Learn how to set up Meilisearch, index documents, and build keyword, semantic, and hybrid search with AI-powered retrieval.
Compare pnpm and npm across security defaults, disk usage, dependency strictness, and workspace policy to decide which package manager fits your project.
Hey there, want to help make our blog better?
Join LogRocket’s Content Advisory Board. You’ll help inform the type of content we create and get access to exclusive meetups, social accreditation, and swag.
Sign up now