
With the Web 3.0 era, the availability of the internet and evolution of web technologies helped web developers implement platform-independent, web-based software. Before this, software folks could only develop platform-dependent, standalone applications.
Nowadays, computer users can find a cloud-based app for nearly any general purpose need on the internet. To make this possible, developers run these cloud-based apps on web servers and typically run multiple backend services, frontend apps, and server-control portals. But how do they efficiently access links of web services to each web server during development? A traditional approach is to create spreadsheets or documents with links, or use web browser bookmarks.
Though practical, these solutions for storing web service links don’t offer centralized editing flexibility, a productive searching feature, clear visuals, and health-check-like networking features. On the flip side, self-hosted dashboard apps help you productively manage web service links and offer efficient ways to access links with keyboard shortcuts and instant searching features.
In this article, I’ll introduce Dashy, a free, open source, self-hosted dashboard app developed with Vue and Node.js. Dashy helps us create beautiful, customizable, modern dashboard pages with web service links and widgets. It also comes with inbuilt multi-language support, authentication, themes, integrated icon packs, and more productivity-focused features. We’ll discuss Dashy’s use cases and explore its features by installing it on the computer via Docker.
The Replay is a weekly newsletter for dev and engineering leaders.
Delivered once a week, it's your curated guide to the most important conversations around frontend dev, emerging AI tools, and the state of modern software.
According to Dashy’s official website, its primary goal is to create customizable dashboard interfaces for web servers by adding self-hosted web service links. But, it is a fully-featured generic dashboard app that we can use in various scenarios, such as:
Dashy’s primary use case is creating a dashboard with self-hosted web service links. It lets you aggregate all the self-hosted web service links of a specific web server into one web page, like Homar, Organizr, and Heimdall.
If you use Dashy in a web server, you can navigate to the Dashy port of the web server IP/URL to browse its available web services. Most Dashy users use Dashy to create dashboards for their home lab servers.
The inbuilt URL bookmarking feature in web browsers helps us easily access websites that we frequently use. Chromium-based browsers support tab grouping and let users save tab groups within bookmarks. However, browser bookmarks won’t offer a productive dashboard with quick editing features. Anyone can use a Dashy instance to manage their bookmarks, regardless of their professional role.
Web developers can use a Dashy instance to store all app and admin page URLs of clients within one place. For example, WordPress developers can create a dashboard links group for each client and add websites, admin pages, and server management (i.e., cPanel) portal URLs. A full-stack developer can even include GitHub repositories, API documentation, etc., per client.
A Dashy project lets us create modern, beautiful, fully-featured web-based dashboards with the following highlighted features:
Dashy lets you add web service links into sections or groups that get rendered in switchable views. You can see links in auto(tiled), vertical, horizontal, and workspace views. It enables productive keyboard navigation, hotkeys support, and an instant search feature to navigate into any listed web service entry. Dashy also lets us enable health-checking for each URL and display web service status with an indicator element.
This dashboard app uses a single YAML file to store website configuration and offers three configuration editing strategies:
v-jsoneditor package)public/conf.yml configuration file directly from the serverBesides, the Dashy development team plans to offer a RESTful API to handle dashboard configuration through HTTP. Then, we’ll be able to update dashboard configurations via a CLI program from any computer without accessing the server filesystem or the Dashy frontend!
Apart from sectioned URL items, the Dashy dashboard can contain widgets. Dashy comes with many inbuilt widgets that let you display time, weather, exchange rates, news, system information, etc.
Its inbuilt widgets also let you display information from third-party tools like Mullvad VPN, HealthChecks, Addy, Nextcloud, AdGuard, and Pi-hole. Moreover, web developers can create custom widgets easily with Vue and Dashy APIs.
The Dashy project is a full-stack app built with Vue and Node.js. Its codebase contains a Dockerfile and deployment configuration for Netlify-like cloud app hosting services. Further, Dashy has an official Docker image on Docker Hub, so you can easily install Dashy into any on-premise web server or managed cloud platform in record time.
Apart from these highlighted features, Dashy also supports authentication, backup/restore, a minimal mode, instant web search, and theme customization.
Now that we’ve talked about Dashy’s use cases and highlighted features, let’s explore it practically and learn how to use it. We can undoubtedly run its source directly by cloning its GitHub repository or downloading it from GitHub releases, but you can run it with just one command if you use Docker.
First, install Dashy with the official Docker image:
docker run -d -p 8080:80 --name my-dashboard --restart=always lissy93/dashy:latest
The above command pulls the Docker image, creates a new container named my-dashboard, and runs the container in detached mode. Give some time for Docker to start Dashy and visit localhost:8080 from your web browser. Your very first Dashy dashboard looks like this:
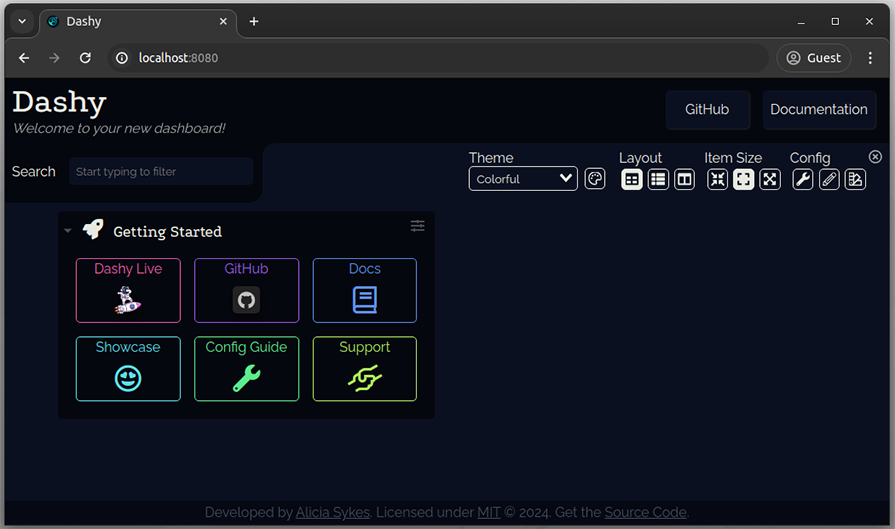
Above, you can see the default dashboard that comes after the installation process.
If you have a home lab server, start installing Dashy on it to get the real experience of a self-hosted dashboard!
Let’s become familiar with our dashboard by learning its screen layout and keyboard actions. Dashy comes with a minimal — but highly customizable — dashboard interface with productive keyboard support and hotkey configuration.
Dashy has three main segments within its interface: header, toolbar, and dashboard items.
The header segment contains the dashboard name, logo, description, and navigation links. All these elements are customizable based on our requirements:

The left side of the toolbar holds a search box element that lets you filter web service links and use a specific web search engine. The right side of the toolbar contains a toolbox that holds various controls, such as the theme selector, layout switcher, configuration editor, etc.:

The third segment of the dashboard interface contains dashboard items. Dashboard items can either be web service link groups or widgets. A fresh Dashy installation creates a sample link group, as shown in the below screenshot:

You can search and click on specific dashboard link items with the mouse or touchpad. You can do this faster by using the keyboard. Enter a search query, press the arrow keys, and press Enter on the selected entry, as shown in this preview:
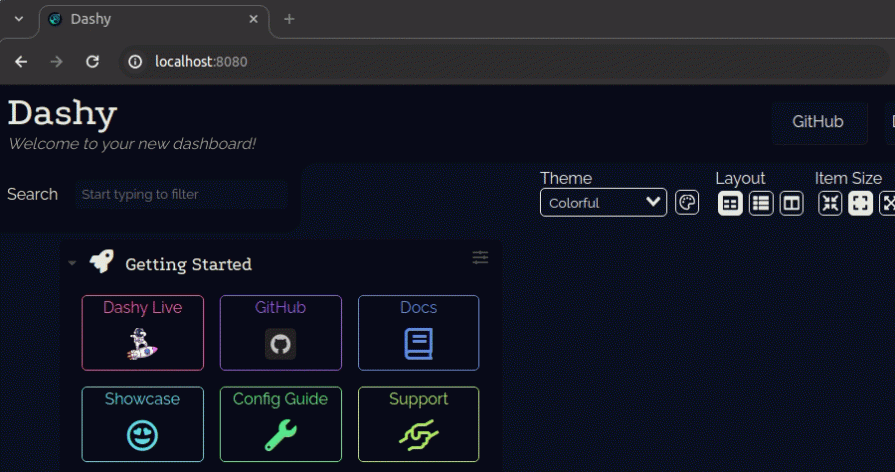
Dashy lets you do a quick web search using the search query by pressing the enter key on the search box. You can also set up hotkeys to open links instantly by pressing a specific key. We’ll discuss setting up hotkeys after learning how to add new sections and links.
Every element you see on the dashboard is indeed customizable according to your requirements. Dashy uses a single configuration file conf.yml to store dashboard configuration. You can edit it easily with the interactive GUI edit mode or GUI JSON editor , or you can edit the YAML configuration file directly from a text editor.
Choose one configuration editing method as you wish. I’ll use the inbuilt JSON editor in this tutorial, so you can copy/paste configurations easily into your Dashy instance.
Let’s get started with basic website configuration by updating the dashboard title, logo, description, footer, and theme.
First, open the JSON configuration editor by clicking on the tool-looking button under Config. Then, select the EDIT CONFIG tab and switch the JSON editor mode as follows:
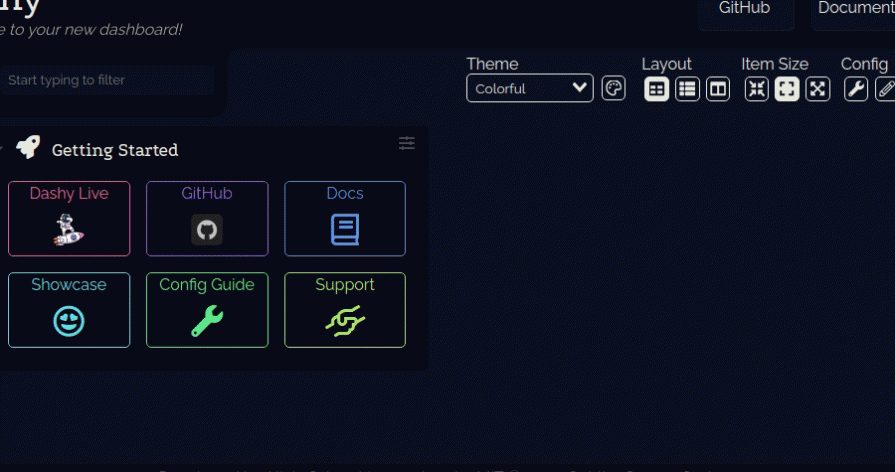
Change the dashboard website title, and description, add a logo, and remove navigation links to build a minimal artistic dashboard:
"pageInfo": {
  "title": "MyDashboard",
  "description": "Welcome to my awesome dashboard!",
  "footerText": "MyDashboard - Made with <em>Dashy</em>",
  "logo": "https://dashy.to/img/dashy.png"
},
Preview changes and click on the disk icon button to save. Note that direct saving doesn’t work at the time of writing this article due to a minor bug. Saving the configuration file triggers a new application build, so check the app after some time:
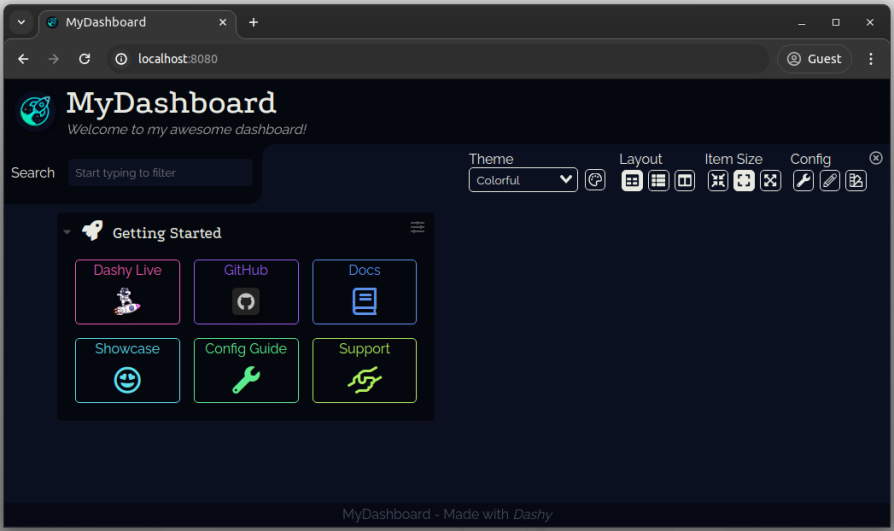
Above, you can see the dashboard app after updating basic website details.
Dashy comes with more than 30 inbuilt themes. You can browse the available theme list from this GitHub link. You can switch the theme from the theme selector in the toolbox, but it saves the selected theme to the client side using the localStorage API, so we can update the theme for all dashboard users as follows:
"appConfig": {
  "theme": "adventure",
  ...
  ...
},
The above theme configuration activates the Adventure theme:
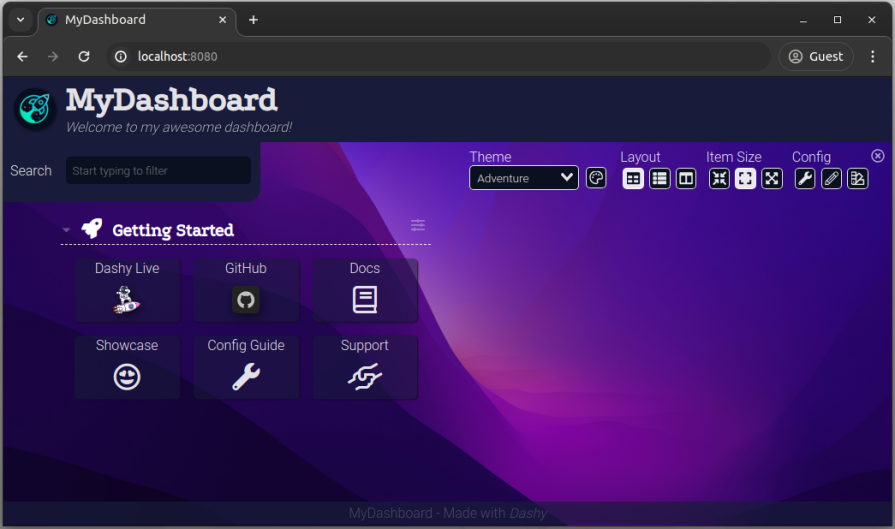
Dashy also lets you customize existing themes and create your own. Check the official theming documentation to learn more.
Right now, we only have the default Getting Started link group that gets created during installation. Let’s add a new link group to learn how to add new dashboard items.
You can create new sections and links with GUI controls by activating interactive edit mode. Turn on edit mode and click on the Add New Section button:
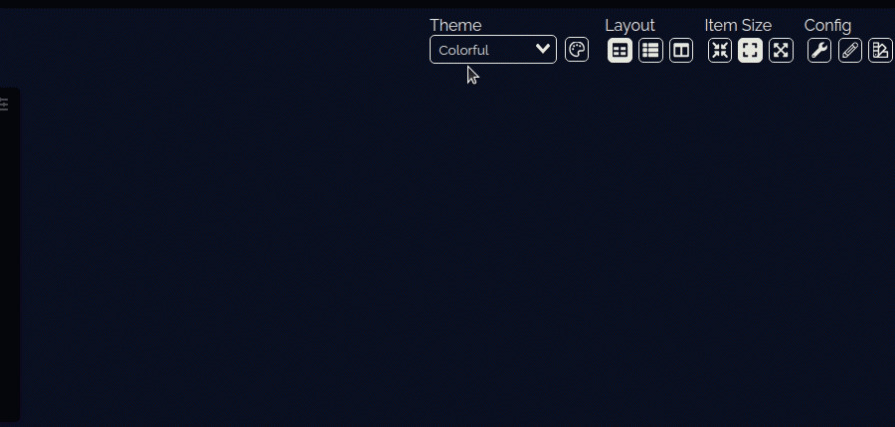
Create a new section by adding the section name “Apps” and icon fas fa-file. Here, we used a FontAwesome icon name, but you can use icons from other supported icon libraries or add a PNG icon.
Now, add new links to the newly created section by clicking on the Add New Item button:
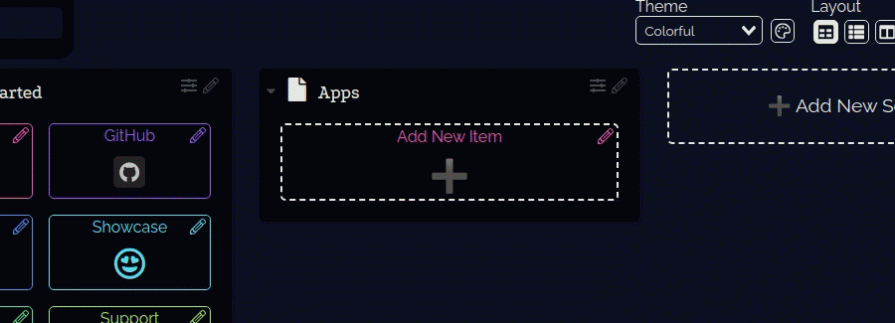
Add several entries and make the section like this:
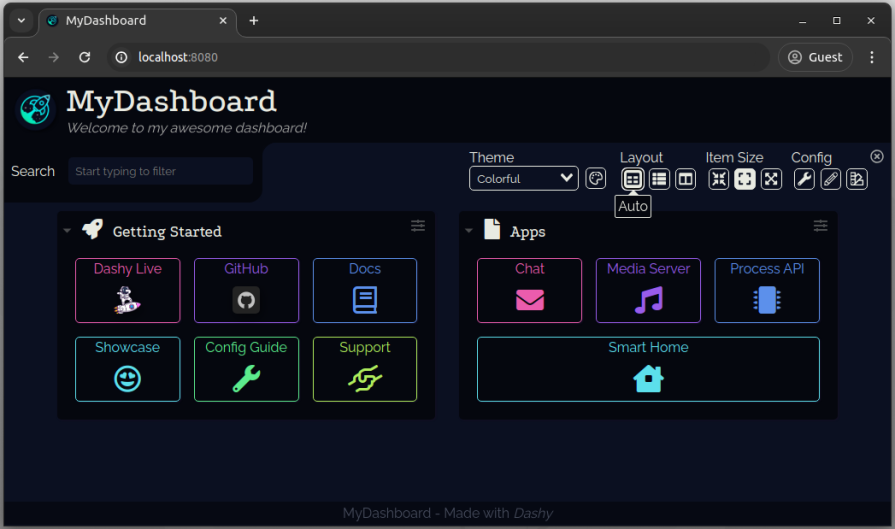
After all edits, save the configuration file to the server to activate the new section for all dashboard users.
The interactive editor approach is great for non-technical users — they can leisurely add new sections and items using GUI controls. However, developers would love to edit the JSON or YAML configuration to add new sections and links.
Open the JSON configuration editor and add the following object to the sections array to add the same Apps section without using the interactive edit mode:
{
  "name": "Apps",
  "icon": "fas fa-file",
  "items": [
    {
      "title": "Chat",
      "icon": "fas fa-envelope",
      "url": "http://192.168.1.5:5000"
    },
    {
      "title": "Media Server",
      "icon": "fas fa-music",
      "url": "http://192.168.1.5:5001"
    },
    {
      "title": "Process API",
      "icon": "fas fa-microchip",
      "url": "http://192.168.1.5:5002"
    },
    {
      "title": "Smart Home",
      "icon": "fas fa-house",
      "url": "http://192.168.1.5:5003"
    }
  ]
}
You can also add hotkeys for specific links by adding the hotkey property to a specific section item object. For example, the following configuration lets us open the chat web service by pressing the 2 numeric key:
{
  "title": "Chat",
  "icon": "fas fa-envelope",
  "url": "http://192.168.1.5:5000",
  "hotkey": 2
},
Every dashboard typically offers a feature to add web service status indicators that show whether a specific service is up or down. In Dashy, you can activate status indicators for all web service entries by using the following app configuration:
"appConfig": {
  ...
  ...
  "statusCheck": true,
  "statusCheckInterval": 10
},
This configuration checks the status of all web services every ten seconds and updates indicators:
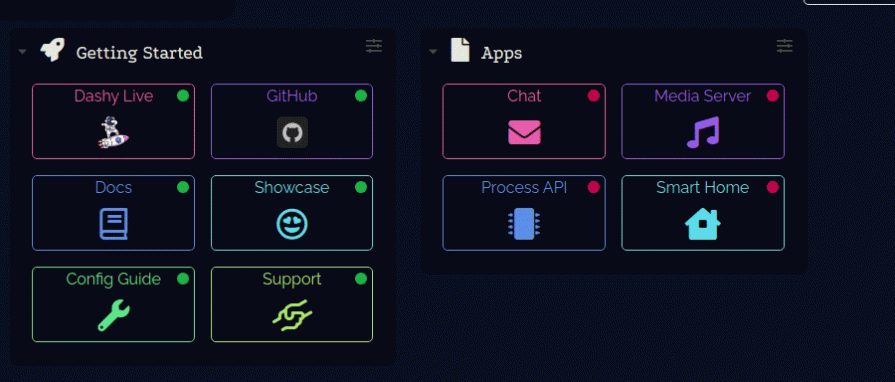
Here, we see red indicators for all links in the Apps section because those web services don’t exist on the network.
A generic dashboard interface typically consists of widgets that provide helpful summarized details. Dashy offers many inbuilt widgets to display time, weather, trending GitHub repositories, networking information, host hardware resources usage, etc., for dashboard users.
Let’s create a new section in the dashboard and add two widgets. We’ll add the clock and joke widgets (the joke one renders random programming joke!).
Create a new section with the following JSON:
{
  "name": "Widgets",
  "icon": "fas fa-cube",
  "widgets": [
    {
      "type": "clock",
      "options": {
        "timeZone": "America/Chicago",
        "hideSeconds": true
      }
    },
    {
      "type": "joke",
      "options": {
        "language": "en",
        "category": "programming",
        "safeMode": true
      }
    }
  ]
}
As you can see, every widget entry has two JSON properties:
type: Widget identifier, i.e., clockoptions: Widget configuration optionsHere, we used clock and joke widget identifiers with options inside a new section. Save the updated configuration. Now you’ll see widgets in a new section:
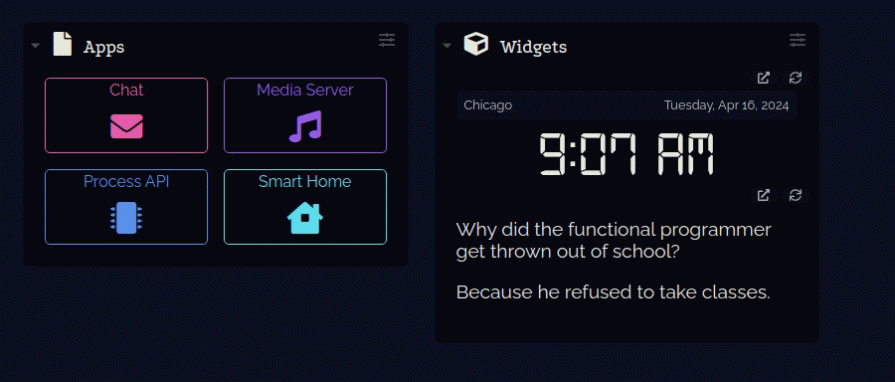
You can edit the widgets array and remove entries to remove specific widgets from the dashboard. Browse all supported widgets from the official widgets documentation.
Dashy offers many pre-developed widgets with every fresh installation, and you can request new widgets from the Dashy development team too. You can also create your own widget if you are familiar with Vue-based frontend development.
The Dashy project loads widgets from its codebase itself and won’t offer a centralized web store to install widgets yet. You can easily modify the source code of the Dashy instance and add a new widget. If you need to re-use a widget in several Dashy installations, you can maintain your own GitHub repository fork since Dashy is an open source project released under the MIT license.
Let’s learn how to create a custom Dashy widget by updating the Docker container’s source files. We’ll create a new simple widget called Cats that displays some facts about cats via the meowfacts.herokuapp.com public RESTful API.
First, enter into the Dashy Docker container’s shell interpreter:
docker exec -it my-dashboard sh
Now, create a new widget component named Cats.vue within the container:
touch src/components/Widgets/Cats.vue
Add the following Vue component implementation to the Cats.vue file:
<template>
<div v-if="catFact" class="cats-wrapper">
  <p class="cat-fact">{{ catFact }}</p>
</div>
</template>

<script>
import axios from 'axios';
import WidgetMixin from '@/mixins/WidgetMixin';
import { widgetApiEndpoints } from '@/utils/defaults';

export default {
  mixins: [WidgetMixin],
  components: {},
  data() {
    return {
      catFact: null,
    };
  },
  methods: {
    /* Make GET request to Cat Facts API endpoint */
    fetchData() {
      axios.get(widgetApiEndpoints.catFacts)
        .then((response) => {
          this.processData(response.data);
        })
        .catch((dataFetchError) => {
          this.error('Unable to fetch any cat facts', dataFetchError);
        })
        .finally(() => {
          this.finishLoading();
        });
    },
    /* Assign data variables to the returned data */
    processData(data) {
      [this.catFact] = data.data;
    },
  },
};
</script>

<style scoped lang="scss">
.cats-wrapper {
  p.cat-fact {
    color: var(--widget-text-color);
    font-size: 1.2rem;
  }
}

</style>
N.B.: You can use the vi editor program to add this code content to the file. Open the Cats.vue file from the vi editor, copy this code segment, and press Ctrl + Shift + V shortcut to paste.
Next, add the cat facts API endpoint to the widget API endpoints in the src/utils/defaults.js file:
widgetApiEndpoints: {
  // ---
  // ---
  catFacts: 'https://meowfacts.herokuapp.com/',
},
Finally, register the newly created widget by modifying the src/components/Widgets/WidgetBase.vue file, as shown in the following code snippet:
const COMPAT = {
  // ---
  // ---
  cats: 'Cats',
};
Visit the Dashy instance from the web browser and rebuild the app:
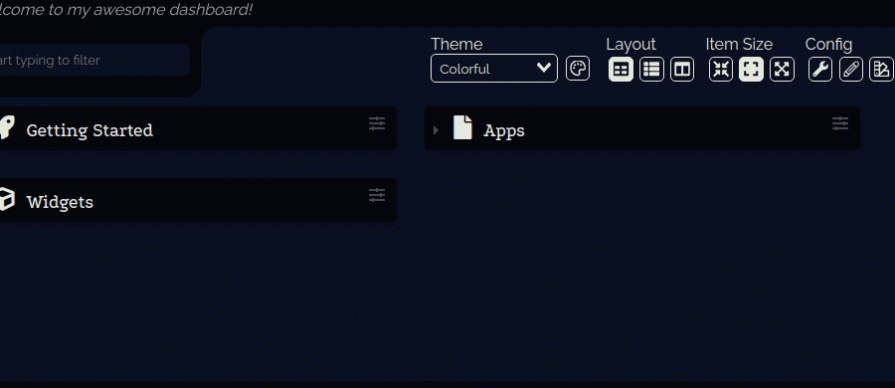
Refresh the dashboard page. Now you will see the newly created Cats widget:

Similarly, you can create any widget for your dashboard using Vue. I demonstrated creating a custom widget by directly editing the Dashy codebase in the Docker container. However, you can fork and clone the Dashy GitHub repository for creating complex widgets.
By default, the Dashy app is publicly accessible, so anyone in the network can access your dashboard if they know the server’s hostname and Dashy port. Similarly, if you deploy your dashboard into a managed server, anyone on the internet can access it if they know the dashboard website URL or public IP. We can disable dashboard configuration and prevent dashboard interface modifications, but it doesn’t make your dashboard truly private.
Dashy has inbuilt basic authentication support with hashed passwords. It also supports the KeyCloak authentication server integration.
You can make your dashboard private with basic authentication by updating the appConfig object with an auth object as follows:
"appConfig": {
  ...
  ...
  "auth": {
    "users": [
      {
        "user": "admin",
        "type": "admin",
        "hash": "8C6976E5B5410415BDE908BD4DEE15DFB167A9C873FC4BB8A81F6F2AB448A918"
      },
      {
        "user": "user",
        "hash": "04F8996DA763B7A969B1028EE3007569EAF3A635486DDAB211D512C85B9DF8FB"
      }
    ]
  }
}
The above basic authentication configuration creates an admin account and a normal user account. Here, we used SHA-256 hash strings for passwords. Note that, the unencrypted passwords are the same as usernames in the above JSON configuration segment.
Save the config and reload the app. Now, you have to log in to see your private dashboard:
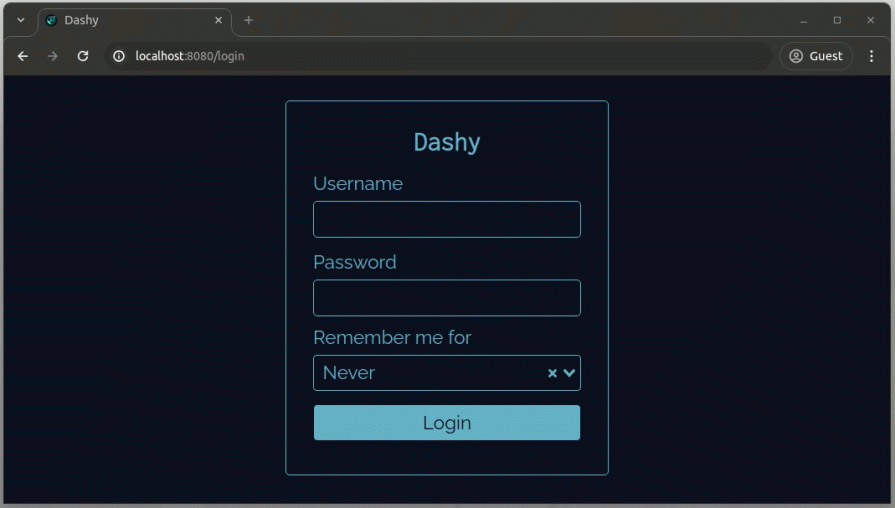
Now, the user account login won’t allow editing the configuration file on the server, but you can use the admin account for updating the Dashy configuration.
The hash-based authentication method is a good authentication strategy for home labs since its configuration is so easy. But, if you need to enable authentication for a dashboard that is open publicly to the internet, you can implement a more secure alternative authentication method, as explained in the official documentation.
In this article, we learned about Dashy and its features by installing it into the computer via Docker. Dashy helps home labs or production servers to aggregate running web services into one web-based interface allowing administrators or users to browse available services from one place. Also, anyone can have their own Dashy instance as an alternative to traditional web browser bookmarks.
Moreover, web developers can use Dashy to store the project details of each client. Homar, Organizr, Flame, and Heimdall popular projects also help us create self-hosted dashboards, but Dashy competitively offers more features to create fully-featured, beautiful dashboards. Its Vue codebase architecture also motivates developers to extend it with custom widgets and themes.
Create a beautiful, customizable dashboard with Dashy and experience how it boosts your daily productivity!
Install LogRocket via npm or script tag. LogRocket.init() must be called client-side, not
server-side
$ npm i --save logrocket

// Code:

import LogRocket from 'logrocket';
LogRocket.init('app/id');
// Add to your HTML:

<script src="https://cdn.lr-ingest.com/LogRocket.min.js"></script>
<script>window.LogRocket && window.LogRocket.init('app/id');</script>

useEffect breaks AI streaming responses in ReactSee why useEffect breaks AI streaming in React, and how moving stream state outside React fixes flicker and stale updates.

A real-world debugging session using Claude to solve a tricky Next.js UI bug, exploring how AI helps, where it struggles, and what actually fixed the issue.

CSS wasn’t built for dynamic UIs. Pretext flips the model by measuring text before rendering, enabling accurate layouts, faster performance, and better control in React apps.

Why do real-time frontends break at scale? Learn how event-driven patterns reduce drift, race conditions, and inconsistent UI state.
Hey there, want to help make our blog better?
Join LogRocket’s Content Advisory Board. You’ll help inform the type of content we create and get access to exclusive meetups, social accreditation, and swag.
Sign up now