Flatologic is a company that offers free and premium dashboard templates in various frameworks. Whether in Angular, Vue, or React, developers can find many user-friendly pre-built applications to suit their needs.
Rather than starting a project from scratch, this drastically reduces the amount of coding involved and gets a project running quickly. In this tutorial, we will focus on their free template called React Dashboard.
This template is built with React, Bootstrap, React Router, Redux, and GraphQL. It comes with a React frontend and a Node.js backend. Authentication is included and the layout is responsive.
This tutorial will cover:
how to create a dashboard in three easy steps. Then, we will connect it to an SQL database with MAMP so you have some local data.
To start with, let’s clone the React Dashboard repository and choose a name for our new project.
git clone -o react-dashboard -b master --single-branch https://github.com/flatlogic/react-dashboard.git <app name>
Once the project is cloned on our local machine, we can proceed with installing the required dependencies.
cd <app-name>
yarn install
At the time of writing, React Dashboard runs into an issue when you run yarn install and there is a GitHub issue logged. Here is a snippet of the error:
    error /Users/..../node_modules/sqlite3: Command failed.
    Exit code: 1
    Command: node-pre-gyp install --fallback-to-build
If you run yarn add sqlite3 separately and then re-run yarn install, things should work fine.
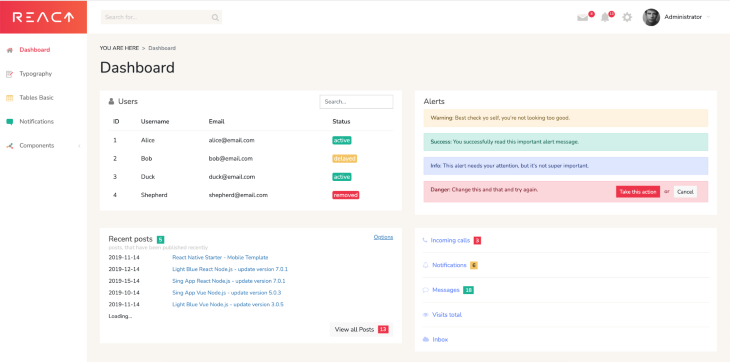
Now, we can run yarn dev. Once done, this will launch the backend and frontend servers, which will be accessible on port 5000 and 3000, respectively. If we navigate to http://localhost:3000/, we should see our dashboard:
This project also comes with GraphQL. Once the app is launched, the playground is accessible at http://localhost:5000/graphql. If you are unfamiliar with this technology, do not hesitate to read the GraphQL documentation and learn how to create queries and mutations.
We have a great dashboard, but at the moment, it is working with hard-coded values. To make it more valuable, let’s connect our new application to a local database.
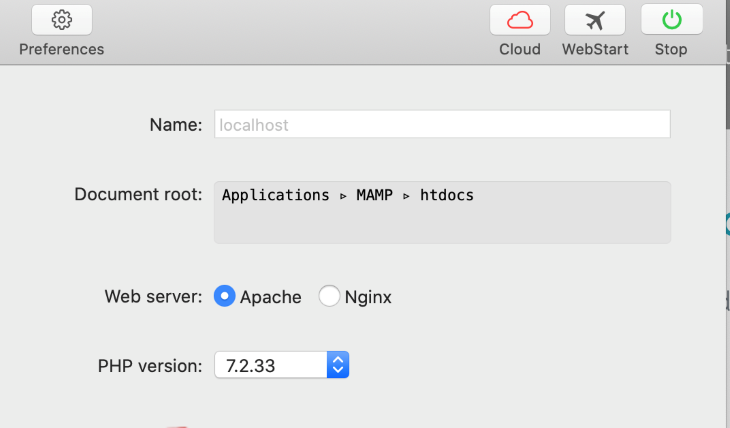
You can choose any database, but for the sake of this tutorial, I will connect a MySQL database. To create one, I am using MAMP, which allows you to get Apache, Nginx, PHP, and MySQL out of the box. If you do not have MAMP, you can download it here.
Once it is installed, start the application and click WebStart.
This opens the MAMP index page at http://localhost:8888/MAMP. On this page, you will see plenty of information, but what we care about is under MySQL. Once opened, click on phpMyAdmin.
This will open another tab, this one to http://localhost:8888/phpMyAdmin/index.php, where you will see the interface of phpMyAdmin. Thanks to this, we will be able to see, create, and work with our future MySQL databases.
We can create a database by clicking on Databases. Then, enter the name of our new database and click Create.
We may then create our first table. For our tutorial, name it posts and select five columns, as we will have five fields. Once we click Go, we will be able to enter our new fields.
Our fields should be as such:
VARCHAR; length 255 is our primary keyVARCHAR; length 255TEXTHere is a screenshot of our table with our new fields:
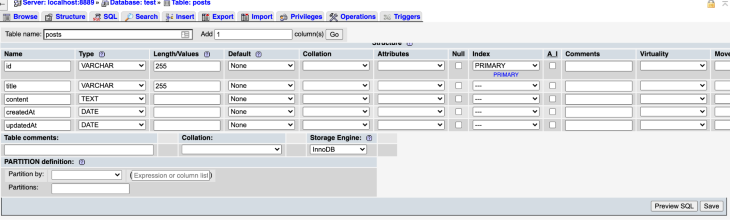
Once we have inputted all the required information, click Save.
This project uses Sequelize, a Node.js ORM that allows you to connect to SQL databases. In our data folder inside src, we find a sequelize.js file where we can connect our database.
import Sequelize from 'sequelize';
    // Configure the connection to your local database with your DB name, username, password and the port on which your DB runs.
    const sequelize = new Sequelize('test', 'root', 'root', {
      host: 'localhost',
      port: 8889,
      dialect: 'mysql',
      operatorsAliases: false,
    });

    export default sequelize;
Then, in the same folder, open the schema.js file and uncomment the mutation for post creation. This will allow us to create new posts in our database from our frontend.
Note: Once again, if you are unfamiliar with the concept of mutation, check out GraphQL’s documentation.
    import {
      GraphQLSchema as Schema,
      GraphQLObjectType as ObjectType,
    } from 'graphql';

    import me from './queries/me';
    import news from './queries/news';
    import posts from './queries/posts';
    import addPost from './mutations/posts';

    const schemaConfig = {
      query: new ObjectType({
        name: 'Query',
        fields: {
          me,
          news,
          posts,
        },
      }),
    };

    // If you want to enable mutation, uncomment the code below
    schemaConfig.mutation = new ObjectType({
      name: 'Mutation',
      fields: {
        addPost,
      },
    });

    const schema = new Schema(schemaConfig);

    export default schema;
Kill the server with Cmd+C and start it again. If everything worked, we should be able to create new posts. In our dashboard, we can click on View all Posts, then Create New. After inputting a title and content, we can click Save. When we go back to the dashboard page, our new post will appear in the table.
At this point, your dashboard is set up and you might be interested in customizing it. In your dashboard, if you head to Components > Buttons, you will see all the color options, including default, primary, and more.
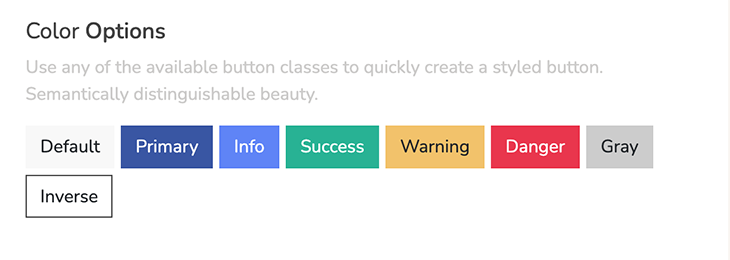
Thankfully, these colors can be easily changed. The way the React Dashboard is set up, all the styling is set up in the src/styles folder. Inside, you will find a file called _variables.scss.
This file contains all the variables used for branding. The ones you need are:
 $brand-primary:         #3754a5 !default;
 $brand-secondary:       #beccfd !default;
 $brand-success:         #1ab394 !default;
 $brand-info:            #5d80f9 !default;
 $brand-warning:         #f3c363 !default;
 $brand-danger:          #eb3349 !default;
You can set these values to your preference and the changes will be automatically applied throughout your dashboard.
Another customization that may interest you is the ability to implement drag and drop functionality. This would allow your users to easily re-arrange their dashboards to suit their needs.
There are a few libraries that can help, such as react-beautiful-dnd, react-dnd or even, react-dropzone. Here are a few guides to help you along:
In this tutorial, we learned how to clone the React Dashboard template from Flatologic and launch it locally. This allowed us to have a user-friendly dashboard up and running quickly.
Then, we created a MySQL database with a table and some fields and connected it to our new application.
Thanks to this pre-built dashboard, developers around the world can quickly build a React application. Starting a project from scratch is always difficult, and these templates come with all the functionalities needed to get started.
Install LogRocket via npm or script tag. LogRocket.init() must be called client-side, not
server-side
$ npm i --save logrocket

// Code:

import LogRocket from 'logrocket';
LogRocket.init('app/id');
// Add to your HTML:

<script src="https://cdn.lr-ingest.com/LogRocket.min.js"></script>
<script>window.LogRocket && window.LogRocket.init('app/id');</script>
A guide for using JWT authentication to prevent basic security issues while understanding the shortcomings of JWTs.

Discover how to build, render, and automate product demo videos with Remotion, replacing traditional screen recordings with reusable React code.
Chrome’s Modern Web Guidance embeds modern web platform skills into AI coding agents, helping them choose native HTML, CSS, and browser APIs over legacy patterns.

Learn how to use Fallow to analyze AI-generated code, detect dead code, duplicate logic, and complexity issues, and integrate automated code quality checks into your AI-assisted development workflow.
Would you be interested in joining LogRocket's developer community?
Join LogRocket’s Content Advisory Board. You’ll help inform the type of content we create and get access to exclusive meetups, social accreditation, and swag.
Sign up now