
Without proper performance monitoring, your application could be using up valuable resources unnecessarily, potentially causing revenue losses that could easily have been avoided. While there are a lot of tools and platforms available to benchmark hosted apps, mobile apps often slip under the radar.

In this guide, we’ll cover the fundamentals of profiling Android applications. We’ll cover what to look out for when profiling Android apps, how to get started with popular tools, and how to reduce resource overuse. Let’s get started!
The Replay is a weekly newsletter for dev and engineering leaders.
Delivered once a week, it's your curated guide to the most important conversations around frontend dev, emerging AI tools, and the state of modern software.
Profiling is a software development practice that helps identify performance and resource management bottlenecks in an application.
Android apps are meant to run on Android devices, which usually have limited hardware resources. Therefore, it is essential that you optimize your app’s resource consumption to provide the best possible experience for your users. Without Android profiling, performance optimization would be nearly impossible.
When profiling your Android apps, there are multiple areas that you can focus on, for one, memory. As one of the most crucial, yet limited resources on mobile devices, improper memory management can lead to App Not Responding errors (ANRs) and application crashes.
Processing is what controls the experience of your users when navigating through your app. Improper management can lead to laggy UIs, app slowdowns, and in the worst case, complete freezes.
Most Android applications rely on a remote server to provide content and information. Improper network management can add unnecessary delays to content loading times, causing a bad experience for your users.
Lastly, since all mobile devices run on some form of battery, you need to optimize your app to consume as little battery as possible. Apps that consume a high amount of battery are usually uninstalled by users quickly.
There are multiple approaches that you can take to profile an Android application, but in this section, we’ll cover three.
You can use the developer tools provided on every Android phone to profile GPU performance on the fly. You’ll first need to do the following:
You’ll notice bars like the ones below on the bottom of your screen:
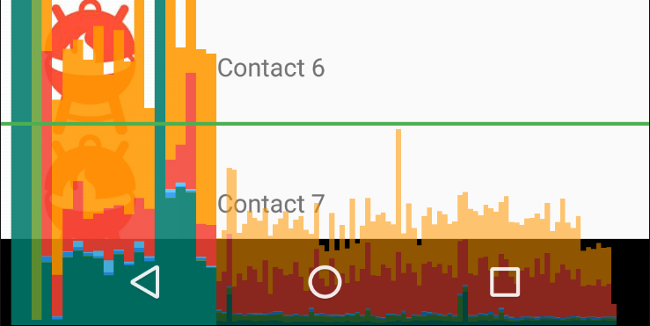
Each vertical bar in this graph represents a frame of your app’s UI. The height of the bars indicates the time it took for the device to render that frame on the screen. The graph also contains information like the time taken by each component of the rendering lifecycle, represented using bars of different colors. You can learn more about it on the official Android Developers website.
Android Studio is the de facto IDE for Android application development, so it comes packed with a ton of profiling abilities. With Android Studio, you can profile almost anything ranging from memory to battery. Each metric has a separate profiling section and provides a range of tweaks and customizations. We’ll dive into more detail on Android Studio in a later section.
If you don’t use Android Studio, or you’re not satisfied with the on-device profiling features that ship with Android, there is another alternative for you. The Android SDK contains an independent Java application that you can use to monitor your Android app’s performance in real-time.
Known as Dalvik Debug Monitor Server, the profiling tool can be launched directly from the command line. DDMS acts as a bridge between your apps and your command line, connecting directly to the virtual machines in your phone. DDMS runs apps, streaming the output of the apps’ debuggers directly to your command line.
DDMS is a very advanced tool, however, it is important to note that this tool is deprecated in Android Studio v3.0. The recommend substitute for DDMS is the new Android Profiler, which we’ll discuss later. Regardless, DDMS can come in handy if you’re working on an earlier version of Android Studio, or if you are looking for a manual approach to debugging Android applications.
You can accomplish a lot with DDMS, including screen capture, port forwarding, incoming call and SMS spoofing, location data spoofing, and accessing Logcat, process, and other app information.
Android Studio is a very detailed tool for Android development and debugging. In this section, we’ll provide basic insights into how you can profile various aspects of your Android app with the profiling tools provided with Android Studio.
Android Profiler is a set of tools provided by Android Studio for profiling Android applications. You can access it by going to View > Tool Windows > Profiler on the menu bar. Alternately, you could also click on the Profile icon in the toolbar.
When you open Android Profiler, it looks like the code below:
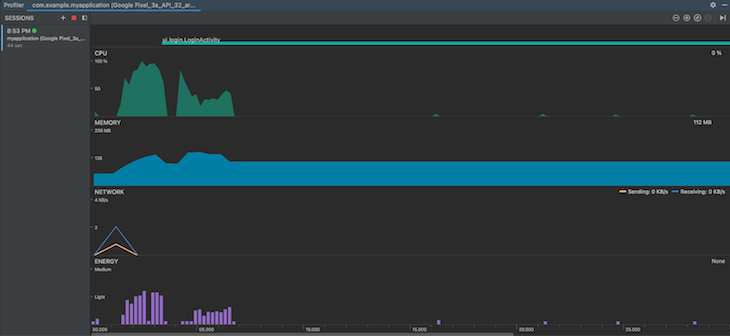
There is a shared timeline that profiles your app simultaneously for CPU, memory, network, and energy. To begin profiling each resource in detail, you can click on each of the individual timelines.
Please note that to access these timelines, you need to connect Android Profiler to a running session. To do so, you need to connect a physical or virtual Android device to your system with debugging enabled, then start an application. Android Studio will identify the running application and generate its live timelines.
The Memory Profiler is one of the most frequently used profiling tools in Android Studio. Observing how your app utilizes available memory is crucial to preventing memory leaks and bloats.
You can also use the Memory Profiler to look for memory allocation patterns that might indicate issues with your app performance. Additionally, you can dump your app’s heap to understand which objects take up your device’s memory. A collection of related heap dumps can help you pinpoint memory leaks.
Recording memory allocation activities during various types of user interactions can help you understand where your app is allocating too many objects at once and if you’ve forgotten to release memory, thereby resulting in memory bloat.
The memory profiling section looks like the image below:
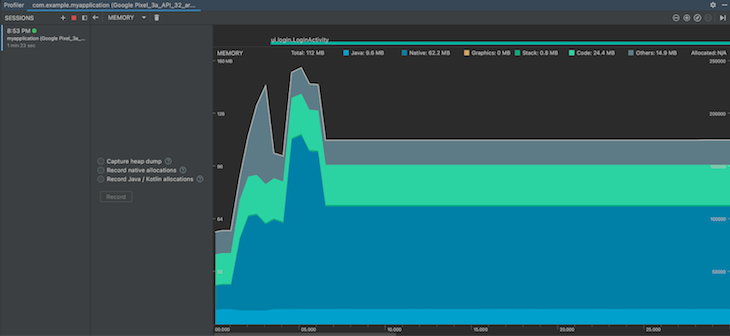
The tool provides you with a timeline that shows various attributes like:
While you get a high-level overview of the memory allocations done by your app, you can also pinpoint individual memory-related activities using the three options available in the middle pane.
Heap dumps show which objects have been created and are occupying memory while the heap dump is being recorded. You can understand the types of objects allocated in the memory, their counts, the memory that they are using, and more.
A sample heap dump looks like the one below:
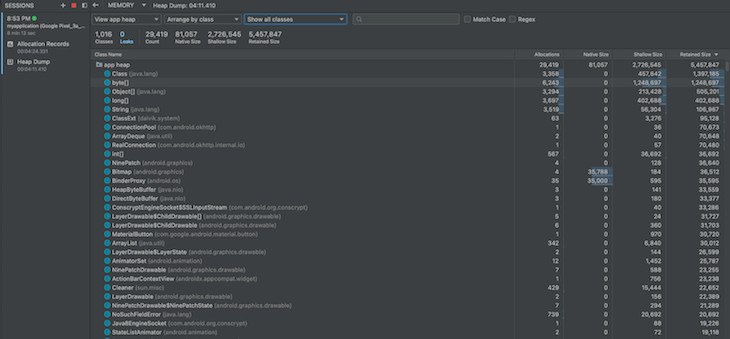
If you choose to record Java or Kotlin object allocations for further analysis, the tool will display the recorded data as follows:
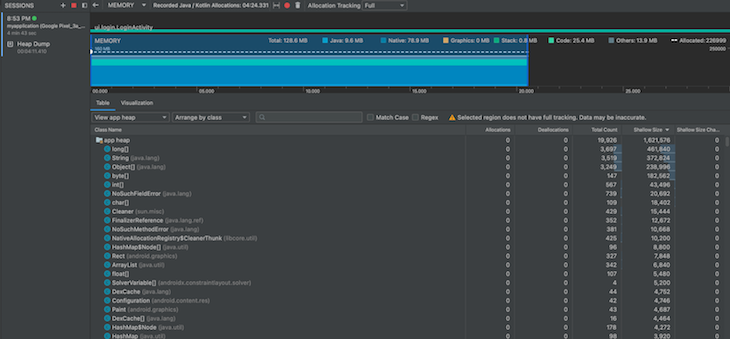
Using the search tool, you can search through this list to identify whether a class has been allocated or not, which is useful when debugging the behavior of a specific piece of code.
When you search for your app’s name, it looks like the following:
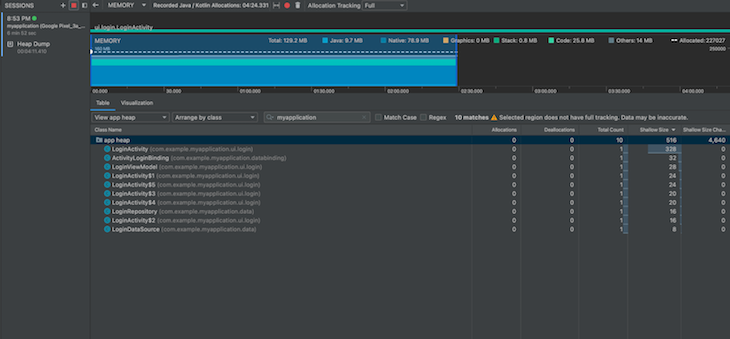
Android Studio provides you with these options to profile your app’s memory usage. However, to make the best use of these tools, you need to develop a profiling strategy.
I’d recommend recording and comparing several heap dumps at fixed intervals to understand where your app is leaking memory. Additionally, you should record object allocations during heavy and light app usage to observe if the number is unreasonably high, which might indicate memory management issues in your code.
Recording the CPU activity of your Android application can help you understand if your app is managing its workload well. The CPU Profiler tool lists the active threads from your application and plots their activity over time. Below is an example of how the CPU Profiler tool displays results:
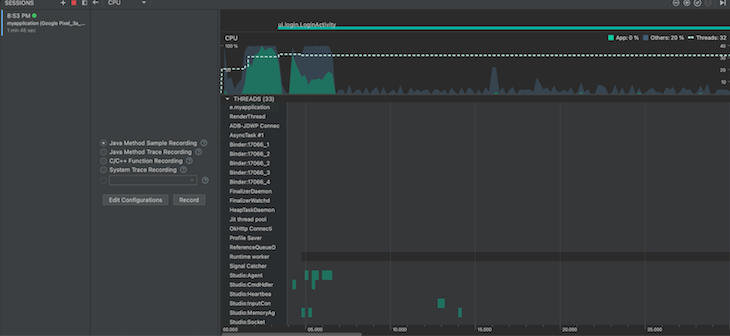
Green horizontal bars are used to indicate CPU activity for a thread. If the thread halts the flow of the app to take in input, the bars will change to yellow, or gray if the thread is asleep.
You can use this data to identify if a thread is using more CPU time than it needs to. You can also visualize how long it takes for each frame to be rendered on the screen, which will point out the activities that need to be reworked to improve performance.
When your app deals with a lot of network interactions, the Network Profiler tool comes in handy. You might need to identify which request is failing, or which endpoint takes longer than usual to serve your requests.
With the Network Profiler, you can record the sequence in which network requests were sent and received, the data exchanged, and the network speed at which the interactions occurred.
In the example below, an image file was downloaded from Unsplash when the login activity was started:
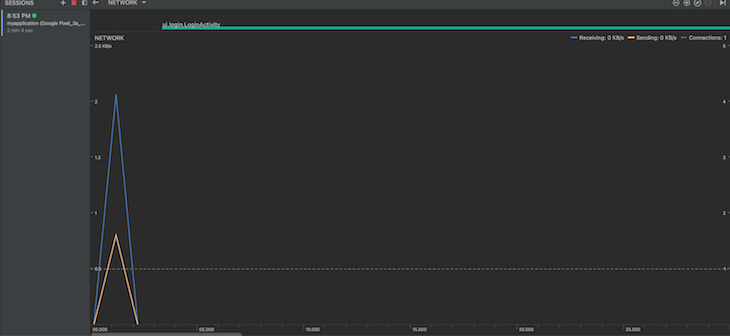
The blue line indicates the download speed, and the orange line shows the upload speed. If you used the HttpURLConnection or the okHTTP libraries for sending and receiving requests, you could also view individual requests’ details on this timeline, which is useful when debugging network responses.
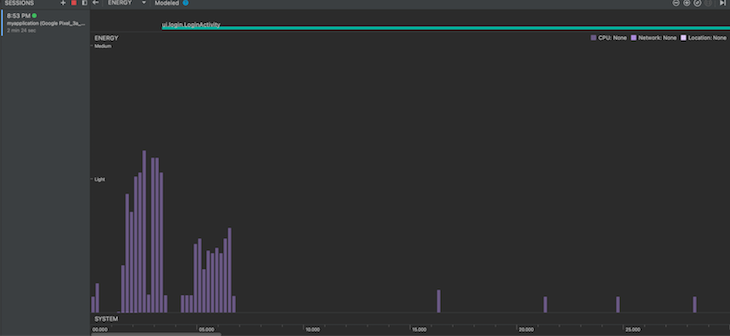
The Android Profiler also packs a battery usage profiling tool known as Energy Profiler, which can visualize your app’s impact on device battery usage over time. You can try carrying out heavy tasks in your app to check if it has a larger impact on the device’s battery consumption.
In the example below, the application held a wake lock for the first five seconds of the runtime. You can observe that the battery usage was high during that time, even though no actual heavy processing was being done. Following this method, the Energy Profiler helps to identify excessive energy usage by Android apps:
While we can use profiling to identify issues with our Android application, it’s always better to minimize or avoid these issues from the beginning. In this section, we’ll identify some best practices that can help you appropriately manage your app’s resource usage.
The Android runtime supports multi-threaded programming. By its architecture, the UI of an Android app is rendered on the main thread, which is why it is called the UI thread.
If you attempt to perform a resource-intensive activity like downloading files or processing images on the UI thread, it will reduce the processor time available to UI rendering activities, thereby making your app’s UI laggy and slow.
To avoid this, you should always dedicate a worker thread that can safely run in the background to heavy jobs, relieving the UI thread of any lags or slow-downs. There are multiple native libraries provided by the Android runtime, which you should consider using in your application wherever applicable.
The Android UI is inflated, or rendered as a hierarchy of views and viewgroups. views are visual elements that you see on the screen, like buttons, switches, etc., while viewgroups are containers used to hold and arrange views.
As you can guess, all views and viewgroups consume space in the runtime memory and must be processed to be rendered on the screen. Moreover, the processing that is run on one view or viewgroup object is run on all of its children objects as well. If your app’s UI is deeply nested, this adds a staggering workload to the device, slowing down your UI and impacting users.
To avoid this, try designing your UI with the simplest hierarchy possible. Avoid using too many LinearLayouts, which restrict your freedom to arrange views inside them. Instead, I prefer ConstraintLayout, which can help you build complex UI arrangements without the need for deep nesting.
Many UI elements, like the navigation bar and sidebar, are reused throughout the application. Many novice developers overlook this and recreate these components wherever they’re needed. For example, let’s assume the code below is our Title bar:
<FrameLayout
    android:layout_width="match_parent"
    android:layout_height="wrap_content" >

    <ImageView android:layout_width="wrap_content"
               android:layout_height="wrap_content"
               android:src="@drawable/app_logo" />
</FrameLayout>
While you could include the Title bar in your activities directly, like in the code snippet below, doing so wouldn’t be the best choice regarding resource management:
<!-- MainActivity.xml -->
<LinearLayout
    android:orientation="vertical"
    android:layout_width="match_parent"
    android:layout_height="match_parent">

    <!-- Title bar here -->
    <FrameLayout
        android:layout_width="match_parent"
        android:layout_height="wrap_content">

         <ImageView android:layout_width="wrap_content"
                   android:layout_height="wrap_content"
                   android:src="@drawable/app_logo" />
    </FrameLayout>

    <!-- Rest of the activity.. -->
    <TextView android:layout_width="match_parent"
              android:layout_height="wrap_content"
              android:text="@string/hello"
              android:padding="10dp" />

    ...

</LinearLayout>
Instead, you should create a separate XML file for the Title bar UI and include it in your code wherever needed:
<!-- MainActivity.xml -->
<LinearLayout
    android:orientation="vertical"
    android:layout_width="match_parent"
    android:layout_height="match_parent">

    <!-- Title bar here -->
    <include layout="@layout/title_bar" />

    <!-- Rest of the activity.. -->
    <TextView android:layout_width="match_parent"
              android:layout_height="wrap_content"
              android:text="@string/hello"
              android:padding="10dp" />

    ...

</LinearLayout>
While this greatly increases code readability, you can take it up a level by using the merge tag to reduce unnecessary parent containers for layouts. To understand this better, let’s take an example of a layout that contains two TextViews:
<!-- @layout/banner.xml -->
<LinearLayout
    android:layout_width="match_parent"
    android:layout_height="wrap_content" >

    <TextView
        android:layout_width="match_parent"
        android:layout_height="wrap_content"
       android:text="@string/hello" />

    <TextView
        android:layout_width="match_parent"
        android:layout_height="wrap_content"
        android:text="@string/world" />

</ LinearLayout>
If you were to include this in another layout, you would always have an unnecessary LinearLayout wrapped around the TextViews. Since XML layout files always need a root parent viewgroup, you can’t get rid of it, unnecessarily adding to the nesting in your UI layout. To solve this, you can use the merge tag to get rid of the parent LinearLayout in your banner.xml file:
<!-- @layout/banner.xml -->
<merge xmlns:android="http://schemas.android.com/apk/res/android">

    <TextView
        android:layout_width="match_parent"
        android:layout_height="wrap_content"
        android:text="@string/hello" />

    <TextView
        android:layout_width="match_parent"
        android:layout_height="wrap_content"
        android:text="@string/world" />

</merge>
Now, when you include this layout in your main layouts, the system will ignore the merge element and place the two TextViews directly in the place of the include tag, flattening the hierarchy of your UI layout and improving your UI’s performance.
Android resources are aggregated and accessed via an interface called Context. Each activity has its own Context, enabling access to resources specific to the activity’s lifecycle. Apart from those, the Android app also has its own Context that is connected to the app’s lifecycle and is more global in nature.
These Contexts are used to access Android resources like SharedPreferences, on-device databases, and more. However, to avoid resource leaks, you must remember to use the appropriate Context whenever you’re creating a resource access object in your memory.
For instance, if you initialize a database access object using an activity Context, the object’s scope will be limited to that activity only. If you try to use it outside of the activity, you’ll have to unnecessarily retain that activity’s Context in memory. Instead, you should consider using the app Context to initialize resource objects that are global in nature.
Developing Android applications calls for the perfect balance of innovation and optimization. As with any type of development, you need to ensure that you are not wasting resources by writing lousy code. Android profiling can help you identify and resolve such cases.
In this guide, we talked about Android profiling in detail, discussing the various areas where you can monitor the performance of your Android application. We also looked at some of the most popular ways to begin profiling your apps and some best practices to keep in mind when developing your next Android application.
I hope that this guide helps you break into Android profiling and take your Android app development skills to the next level. Happy coding!
Install LogRocket via npm or script tag. LogRocket.init() must be called client-side, not
server-side
$ npm i --save logrocket

// Code:

import LogRocket from 'logrocket';
LogRocket.init('app/id');
// Add to your HTML:

<script src="https://cdn.lr-ingest.com/LogRocket.min.js"></script>
<script>window.LogRocket && window.LogRocket.init('app/id');</script>

Learn about TypeScript v6’s breaking changes, new ES2025 features, and deprecated options. A complete migration guide from v5 to prepare for v7.

Learn how Vite+ unifies Vite, Vitest, Oxlint, Oxfmt, Rolldown, and Node.js management in one CLI.

AI companies are buying developer tools as coding agents turn runtimes, package managers, and linters into strategic infrastructure.

Learn how AI-assisted development governance uses rules, agents, hooks, and protocols to help AI coding tools produce safer, more consistent code.
Would you be interested in joining LogRocket's developer community?
Join LogRocket’s Content Advisory Board. You’ll help inform the type of content we create and get access to exclusive meetups, social accreditation, and swag.
Sign up now