Understanding problems in web apps is hard. Mysterious JavaScript errors, slow performance, user-reported bugs, and vague UX issues can frustrate users and monopolize developer time. And these are just the obvious issues — most bugs are never actually reported since users who have a bad experience just leave or suffer in silence.

Traditional error reporting tools capture some useful information like stack traces, but many teams find they suffer from three key flaws:
LogRocket’s Issue Management solves these problems by providing an easy-to-use dashboard that visualizes the health of your frontend application. Think of it like an inbox where issues are surfaced and tagged, with a powerful rules engine that automatically categorizes issues based on how impactful they are for your users.
Issue Management currently surfaces JavaScript errors, with more issue types like Network Errors, UX issues (rage clicks, thrashes, dead clicks), Browser Crashes, and Lost Conversions currently in beta.
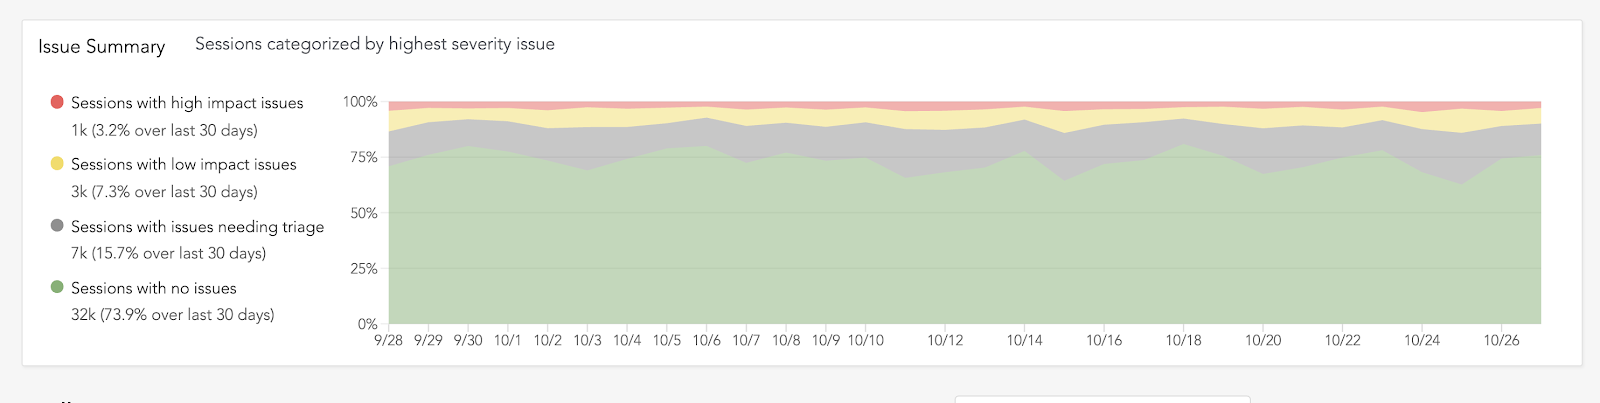
The foundation of Issue Management is the Summary View, which shows the percentage of user sessions that are affected by issues of different types over time. This configurable visualization provides an understanding of the overall health of your application, which has traditionally been difficult to ascertain from the barrage of noisy errors within conventional error reporting tools.
In a modern production application, there will always be new issues appearing, as well as known issues continuing to resurface. Having context on how application health has evolved over time gives teams enhanced confidence and the ability to prioritize fixing issues that have the greatest impact on customer experience.
During beta testing, we found many teams rally around this metric, using it to set goals or internal SLAs around the percentage of issue-free sessions. At LogRocket, where we of course dogfood our own product, we target 90 percent of sessions being issue-free, with no more than 1.5 percent of sessions experiencing high-impact issues.
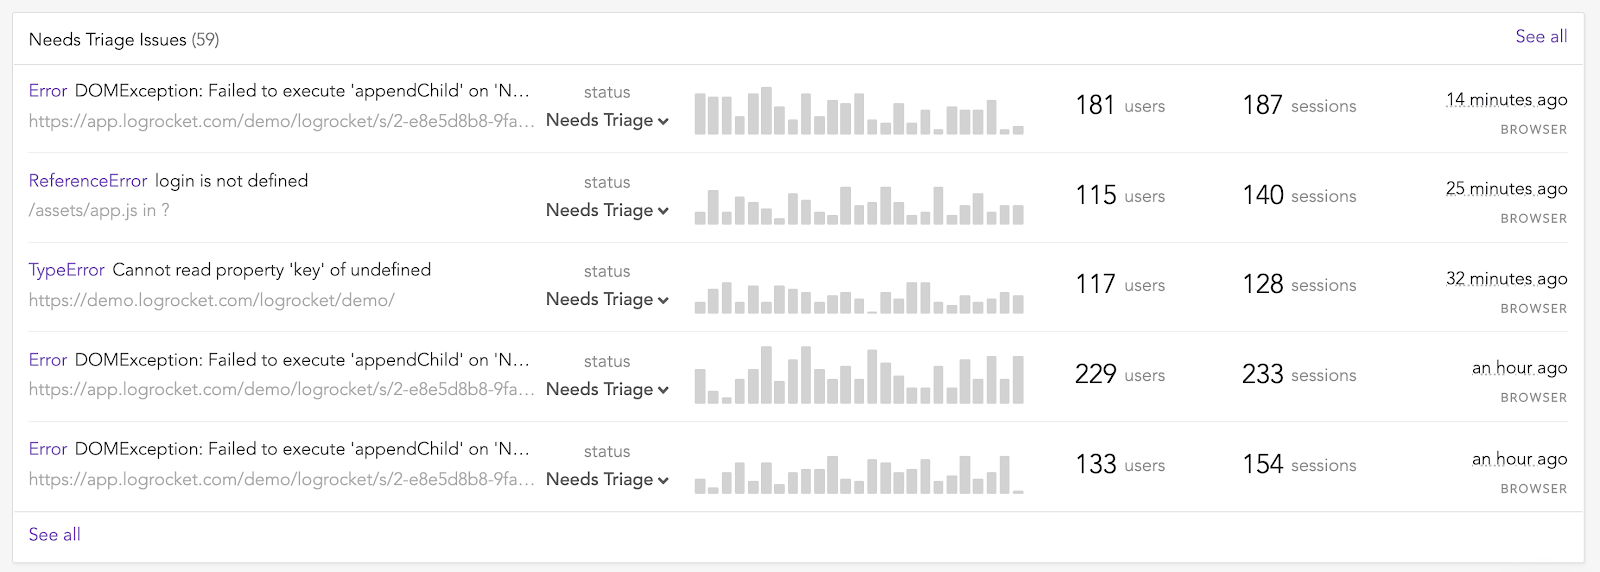
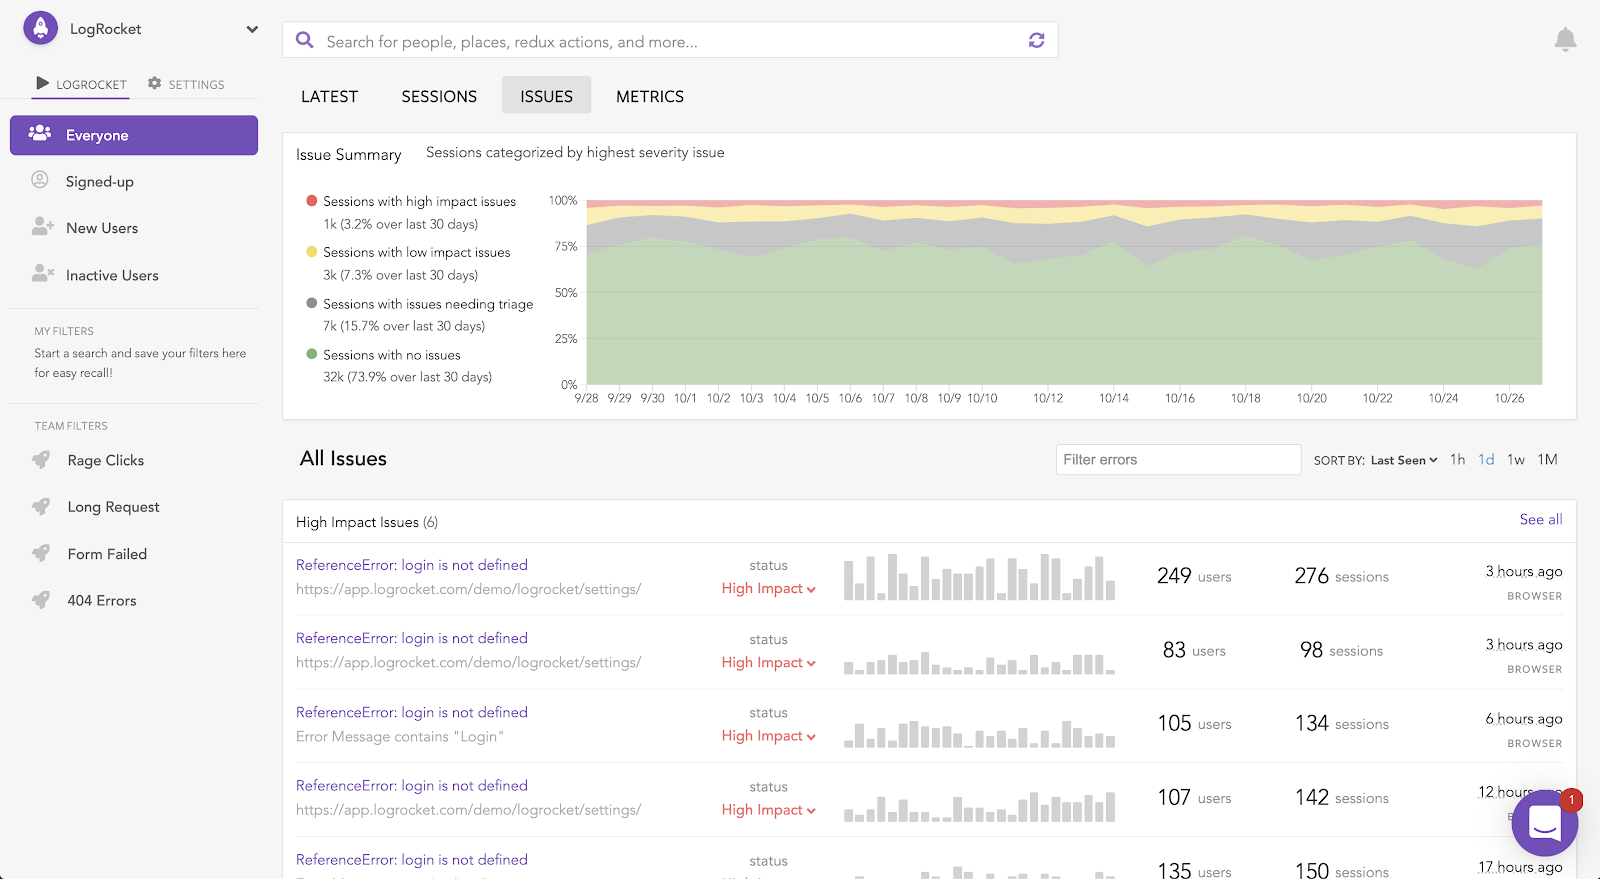
Below the Summary View is a list of active issues ranked by priority.
Upon opening an issue that needs triage, LogRocket shows a pixel-perfect session replay video that accurately captures what the user saw on screen. This makes it easy to evaluate the effect an issue had on the user, which can range from nothing (roughly 45 percent of JavaScript errors have no effect on the user, according to our research) to completely disabling your app.
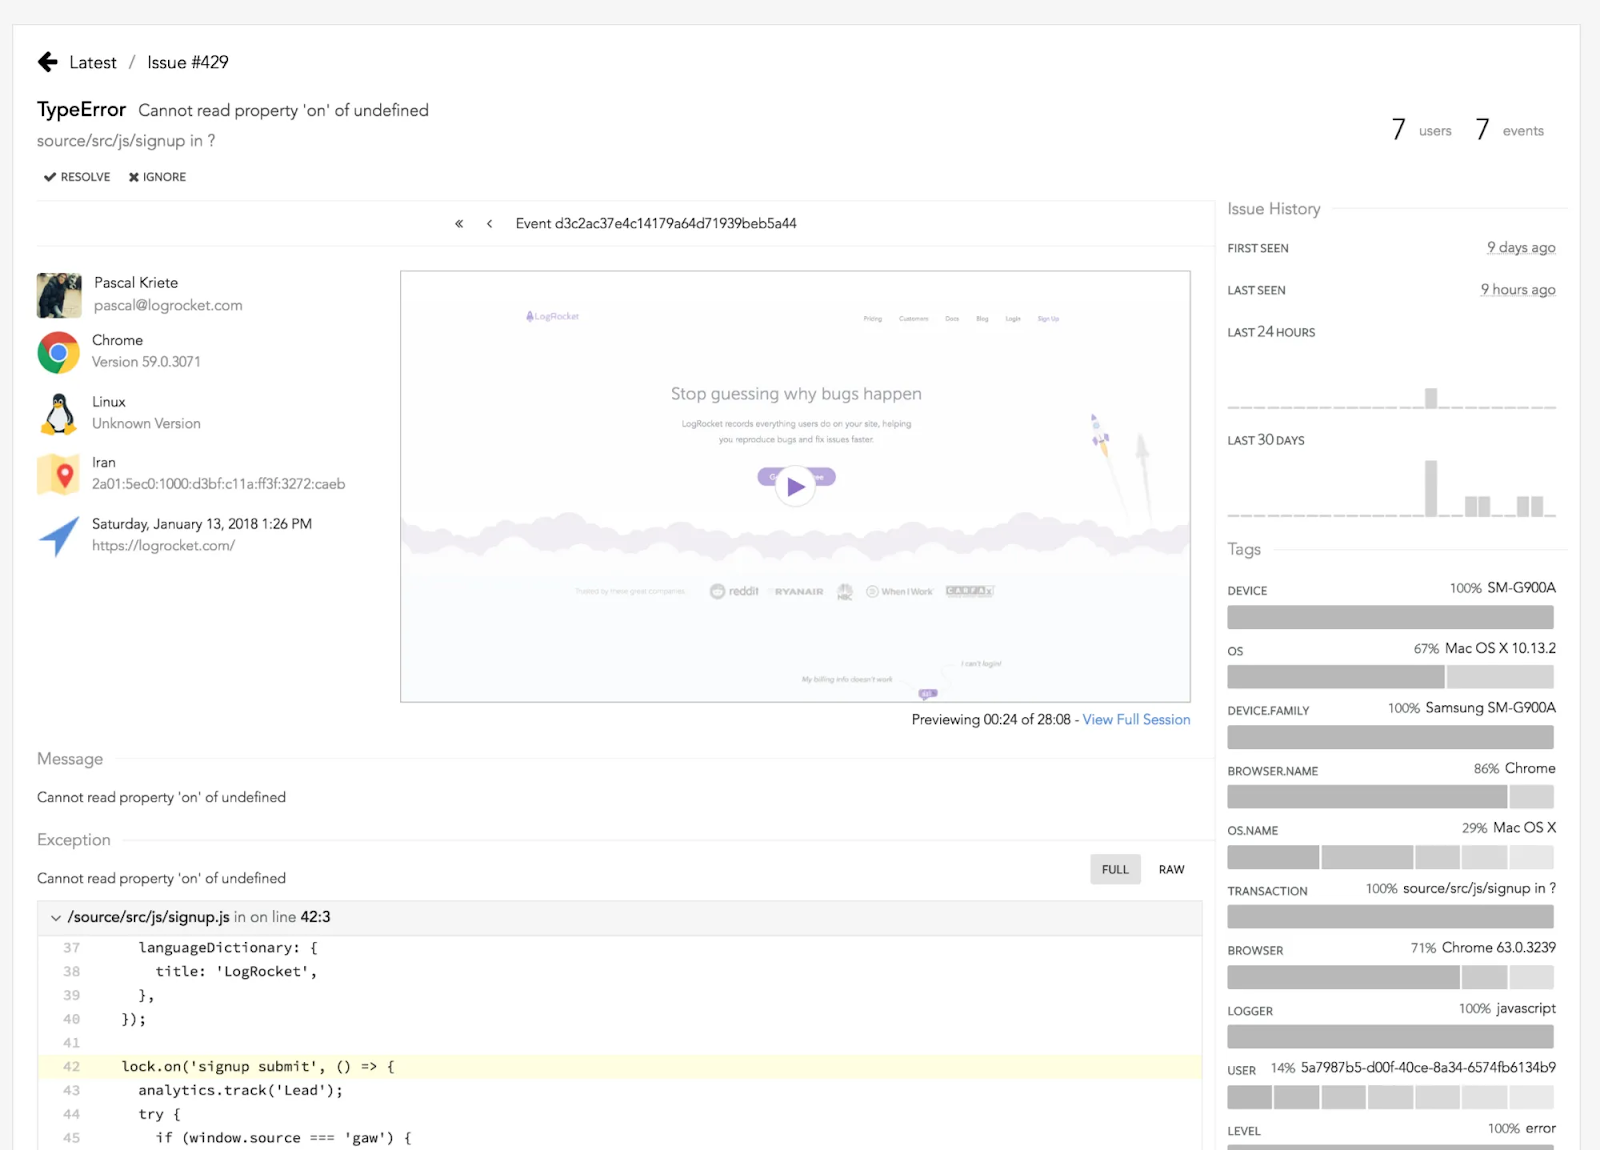
To create the session replay video, LogRocket instruments the DOM to record the HTML and CSS on the page at the time of the issue. LogRocket also records console logs, JavaScript errors, stack traces, network requests/responses, CPU/memory usage, and browser crashes to give you additional context on how to reproduce issues. It also has deep integrations with libraries like React, Redux, and Angular to log actions and application state.
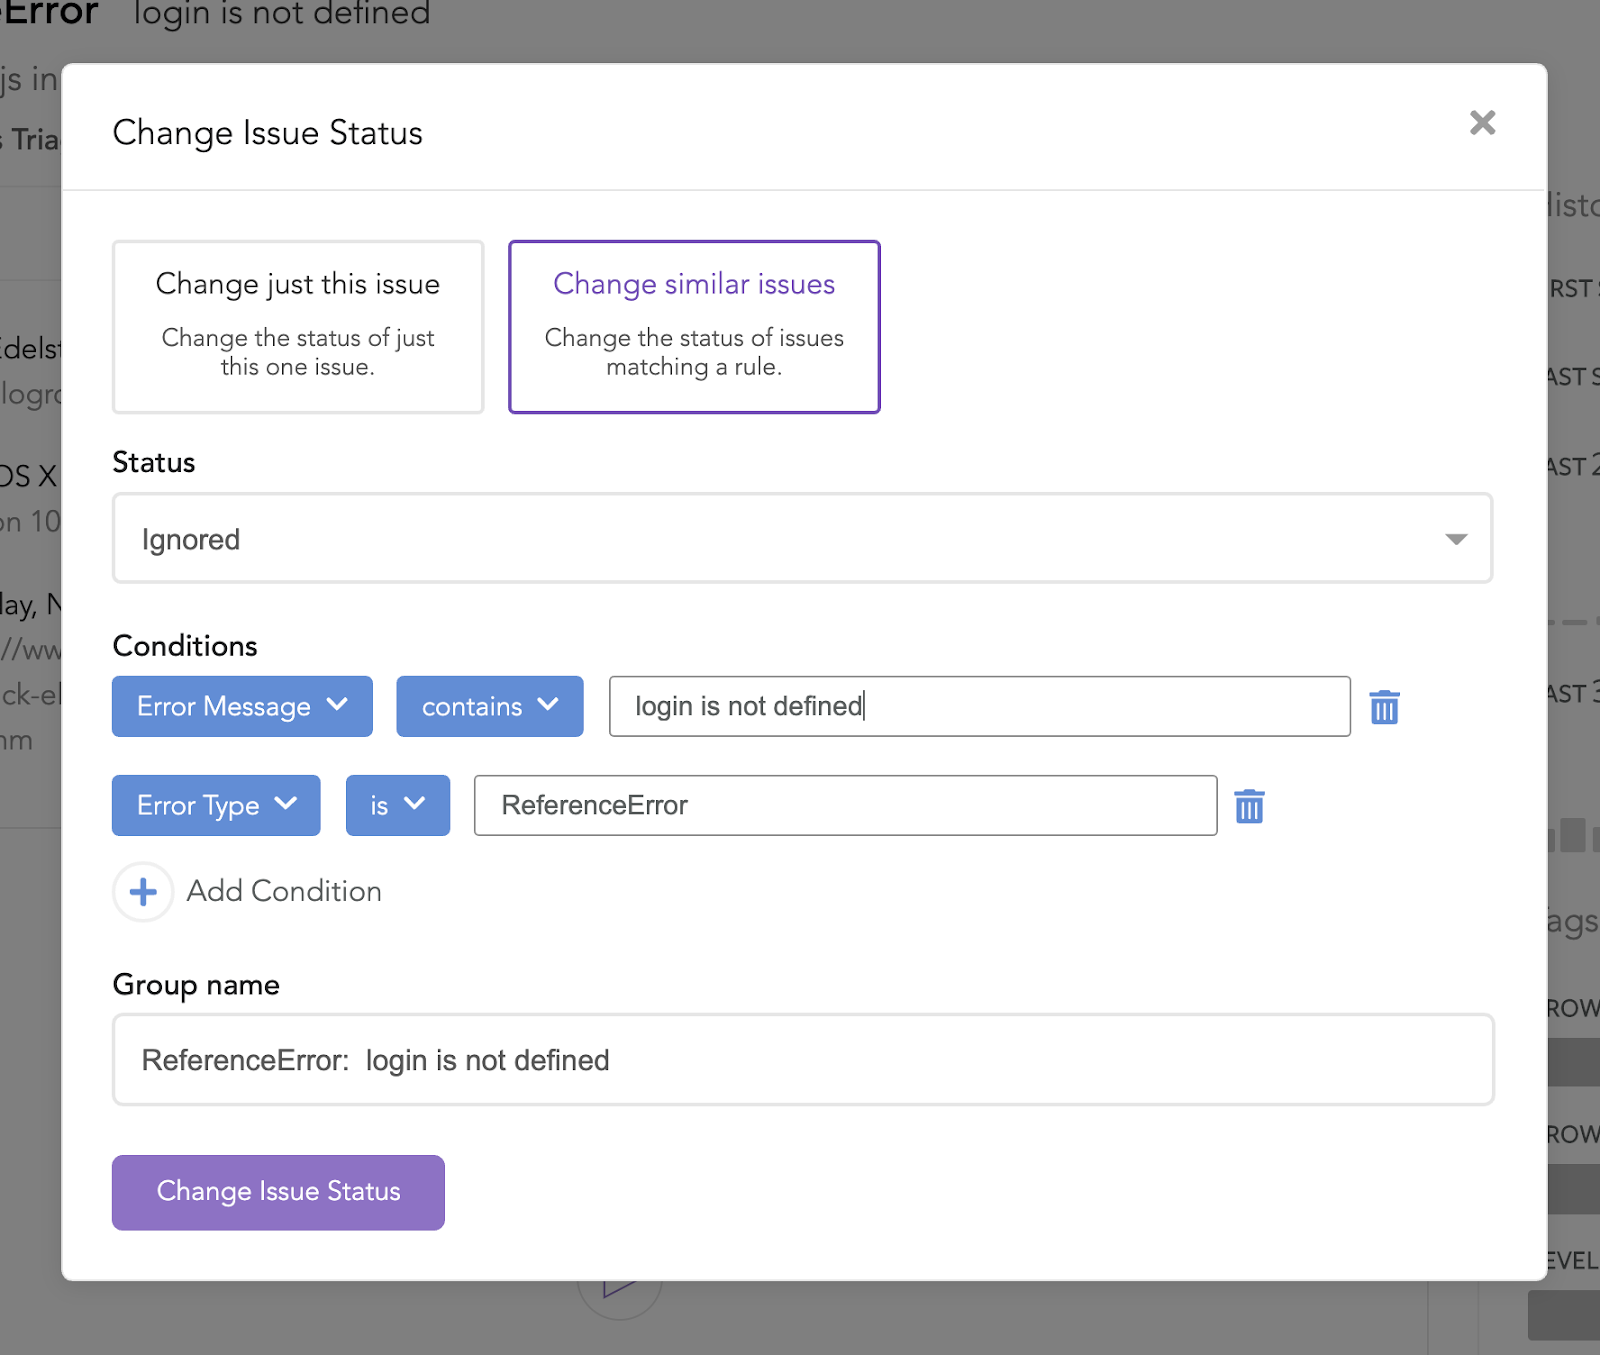
Once you’ve watched the LogRocket replay and determined the impact an issue has on your users, LogRocket’s rules engine lets you tag it so that similar issues will be categorized automatically should they occur again. This automation helps cut down the noise of traditional error reporting tools as well as ensure that new, high-impact issues receive attention quickly.
Receiving timely alerts is key to fixing critical issues quickly before they affect users. However, the noisy alerting in traditional error reporting tools and the lack of context on issue impact often cause alert fatigue. Too many alerts for vague or unimportant issues lead to a cluttered inbox and risk of missing important information.
LogRocket’s alerting uses our rules engine to prioritize alerts for issues likely to be high-impact. We communicate through Slack, email, or tools like Pagerduty to immediately show you a video replay of an issue to streamline the triage process. Many exciting improvements to alerting are currently in beta, and we plan to announce more in the coming months as these features launch.
The shift toward rich single-page apps has undoubtedly improved both user experience quality and developer productivity. But with greater complexity comes the need for more observability. Existing tooling is not yet sufficient for teams to have confidence in the frontend code they ship.
With the launch of Issue Management, we’ve taken what we believe is another big step toward a solution. In conjunction with Metrics, Insights, and our core Session Replay functionality, LogRocket provides a unified platform for product and engineering teams to monitor and improve their applications.
If you want to help define the next generation of tooling for frontend developers, we’d love to meet you. We’re hiring.
Would you be interested in joining LogRocket's developer community?
Join LogRocket’s Content Advisory Board. You’ll help inform the type of content we create and get access to exclusive meetups, social accreditation, and swag.
Sign up now
This guide walks you through creating a web UI for an AI agent that browses, clicks, and extracts info from websites powered by Stagehand and Gemini.

This guide explores how to use Anthropic’s Claude 4 models, including Opus 4 and Sonnet 4, to build AI-powered applications.

Which AI frontend dev tool reigns supreme in July 2025? Check out our power rankings and use our interactive comparison tool to find out.
Learn how OpenAPI can automate API client generation to save time, reduce bugs, and streamline how your frontend app talks to backend APIs.

