

Major browsers now ship a way for AI agents to open your app, look around, and debug it. Chrome’s comes from Google. Safari 27 added one from Apple. Firefox’s is maintained by Mozilla.

So I did what I normally love doing. I built a small React app, planted four bugs in it, and gave all three to debug.
My theory behind this was that browser tools stop at the DOM, so none of them would find the cause of a React re-render bug without extra help. I was half wrong, and that half tells the story in this article.
Here’s the short version:
memo. The memo was already thereOne thing to note before we start. Most of these numbers come from one or two runs each. Read this as a field report, not a lab benchmark; here is the GitHub repo.
An agent debugging MCP is a small server that sits between your coding agent and a real browser. The agent calls tools like “list the network requests” or “run this JavaScript”, and the browser answers.
We’ve already covered how to connect the Chrome DevTools MCP, so I’ll skip the setup tour. Here are the three things that tripped me up instead:
safaridriver --mcp answers with unrecognized option '--mcp'. After the update, you tick “Allow remote automation and external agents” in the Developer settings, and you’re in--tool-preset developer. Remember this flag. It decides the test later--categoryExperimentalThirdParty=trueThere’s also a cost you pay before the agent does any work. Every tool a server offers gets described to the model on every run. I measured that with a one-word prompt:
| Setup | Tools | Extra input tokens |
|---|---|---|
Safari 27 (safaridriver --mcp) |
17 | 3,846 |
Chrome (chrome-devtools-mcp 1.10.1) |
30 | 7,797 |
| Chrome with the React tools flag | 32 | 8,194 |
Firefox (@mozilla/firefox-devtools-mcp 0.10.4, developer preset) |
48 | 8,207 |
With no MCP at all, the same prompt used 5,807 input tokens. Safari costs about half of what the other two cost, because it ships about half the tools. Keep that in mind, because fewer tools cut both ways.
The app is a small dashboard built with Vite 8, React 19.3, and TypeScript. It has a row of 8 project cards, a notes box, and a big activity table. React Compiler is off because it could quietly fix the React bug for me.
I planted four bugs:
await inside a loop. That takes about 3 seconds when 350 ms would do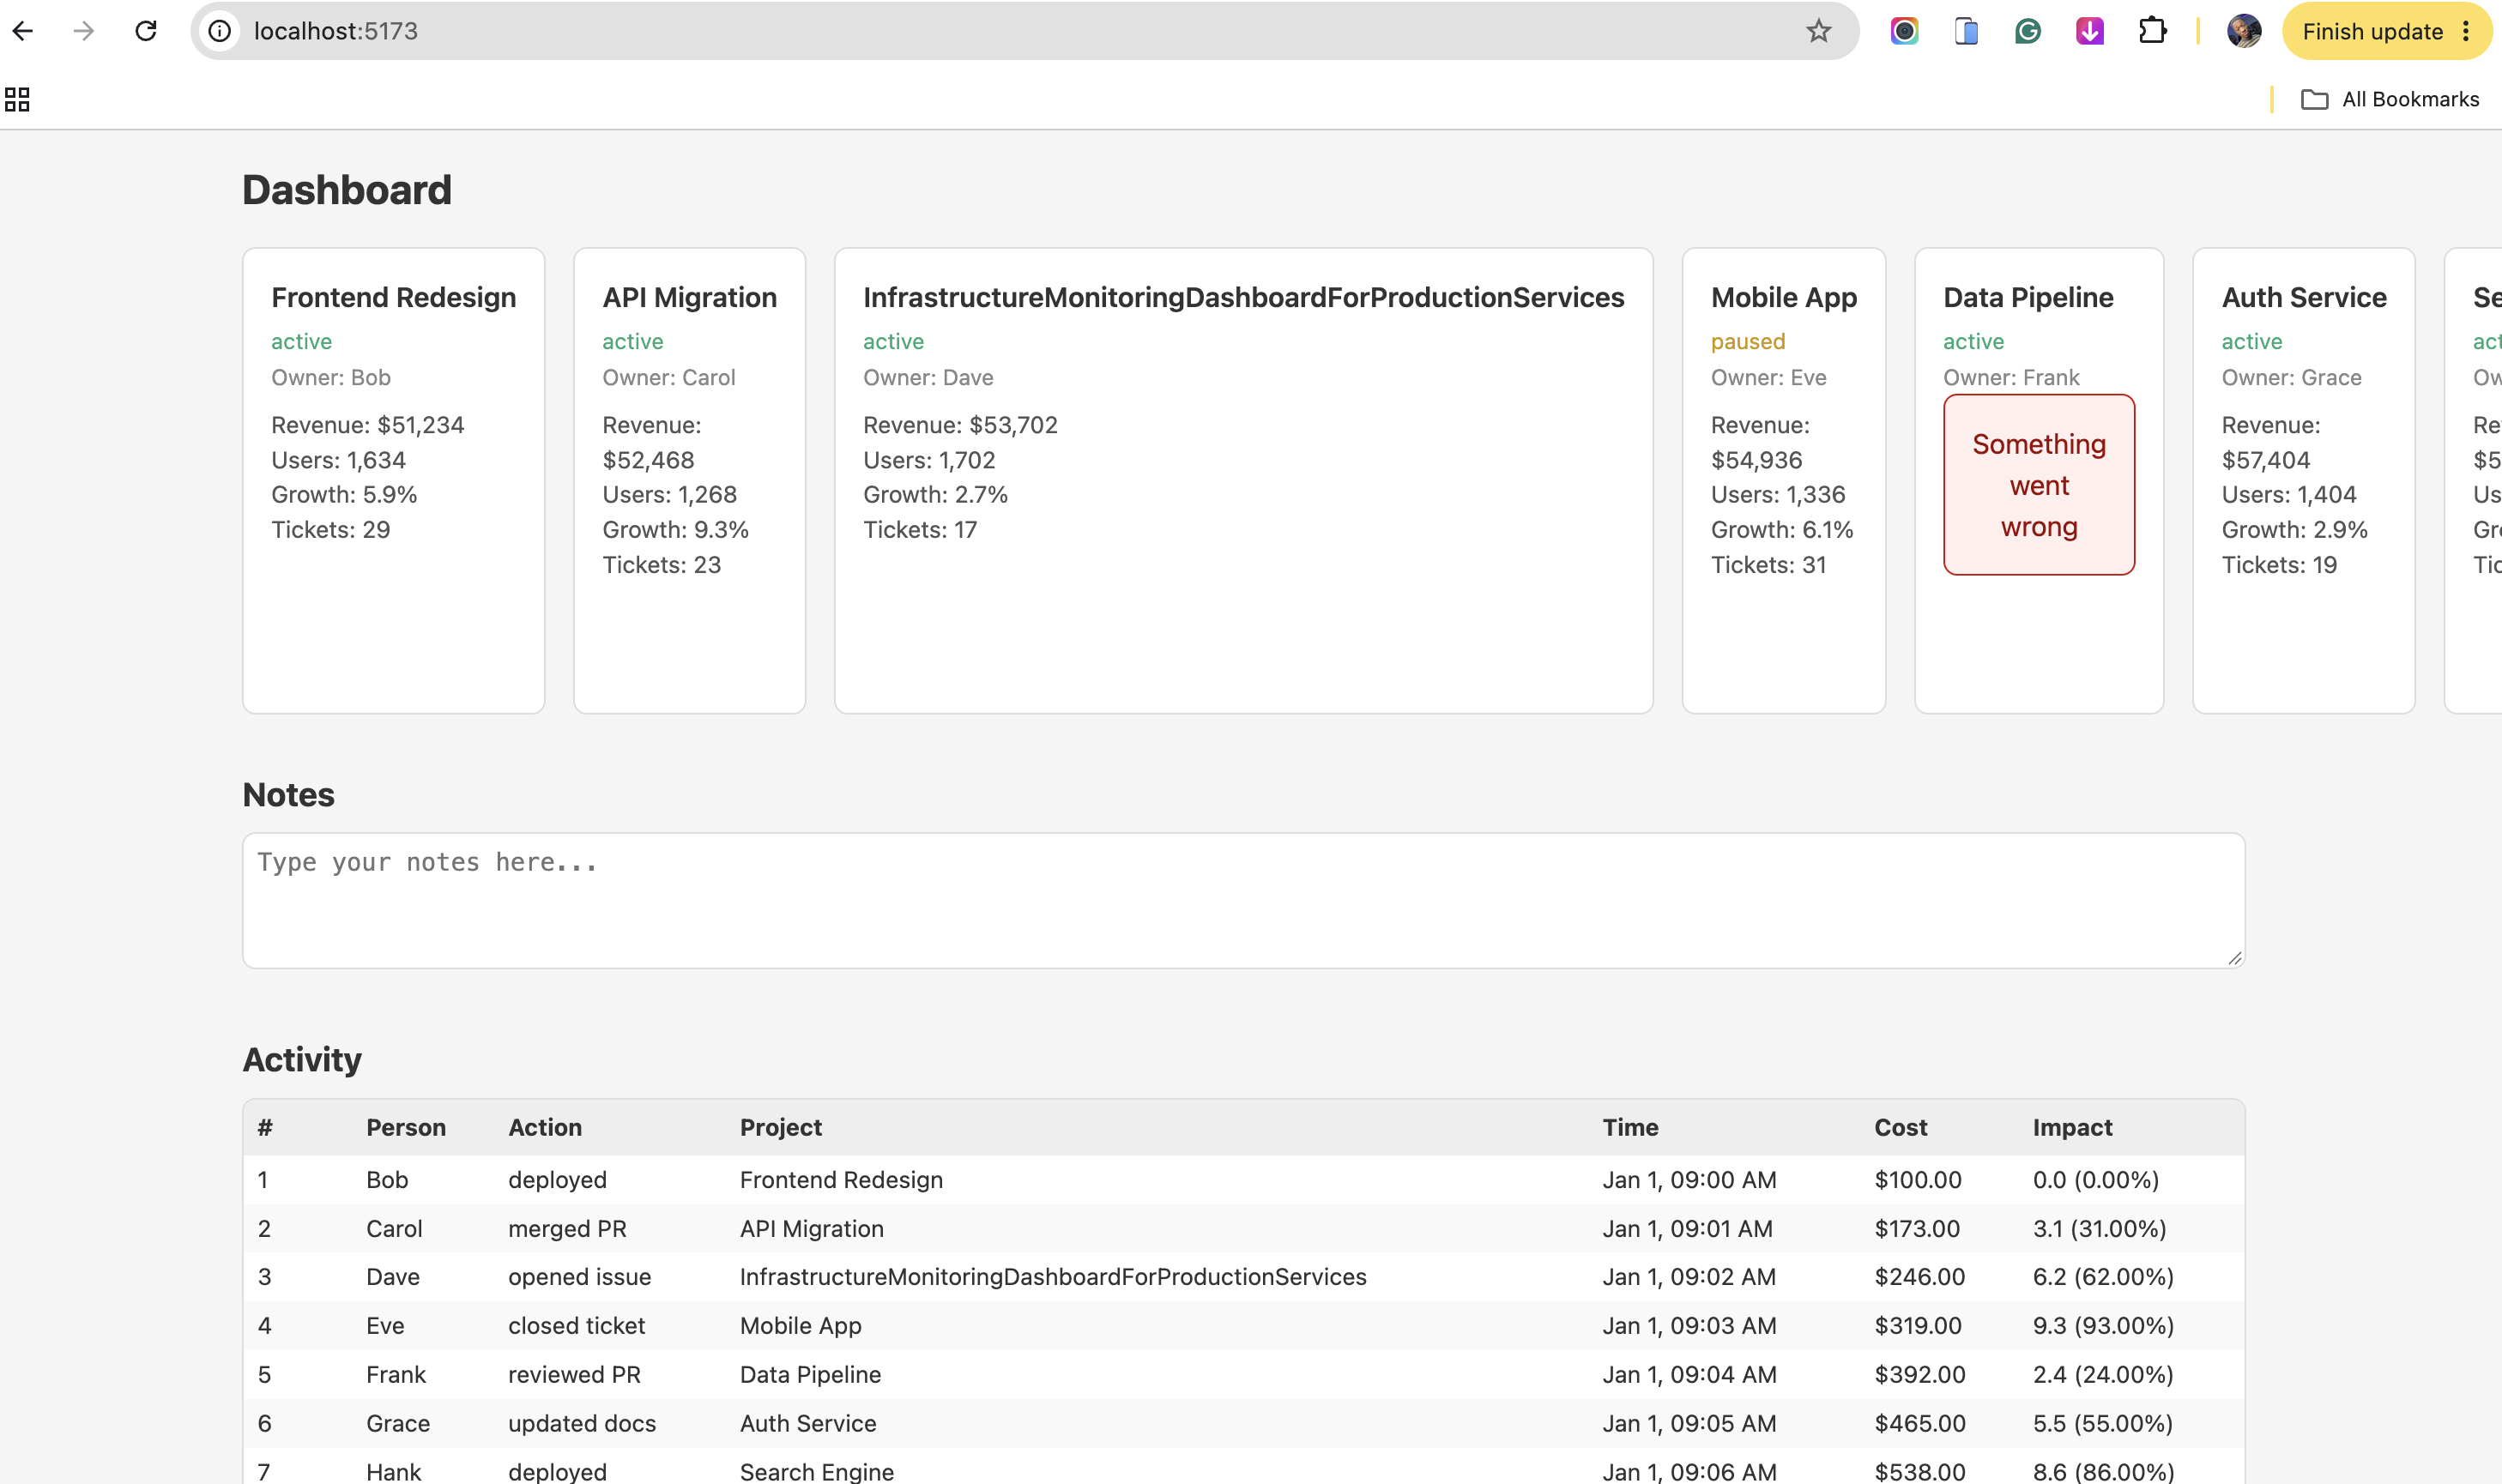
Bug 4 is the one this article is about, so here’s the code:
// AppContext.tsx
<AppContext.Provider value={{ user, theme, draftNote, setDraftNote }}>
  {children}
</AppContext.Provider>

// ActivityTable.tsx
const TableRow = memo(function TableRow({ row }) {
  const { theme } = useAppContext();
  // builds 11 Intl formatters, then renders the row
});
The text of the notes box lives in the same context as the theme. Every keystroke builds a new context value. Every row reads that context, so every row renders again, and memo can’t block a context update. The rows only wanted the theme. They got your whole diary.
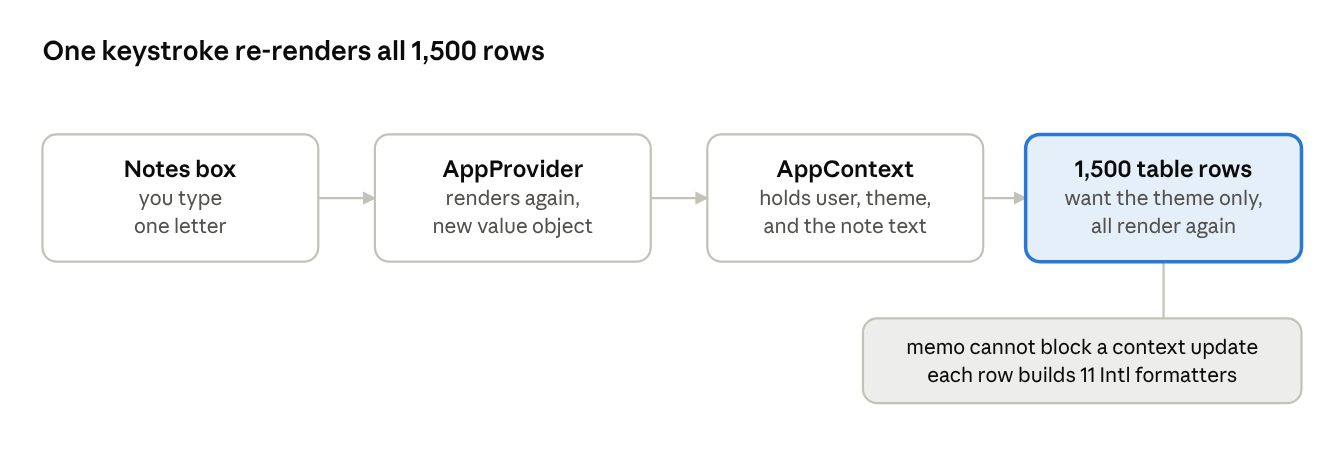
I started with 300 rows. My M4 Mac didn’t even blink, so I raised it to 1,500, then I noticed it.
The agent was Claude Code 2.1.97 running Opus 4.6. I set four rules:
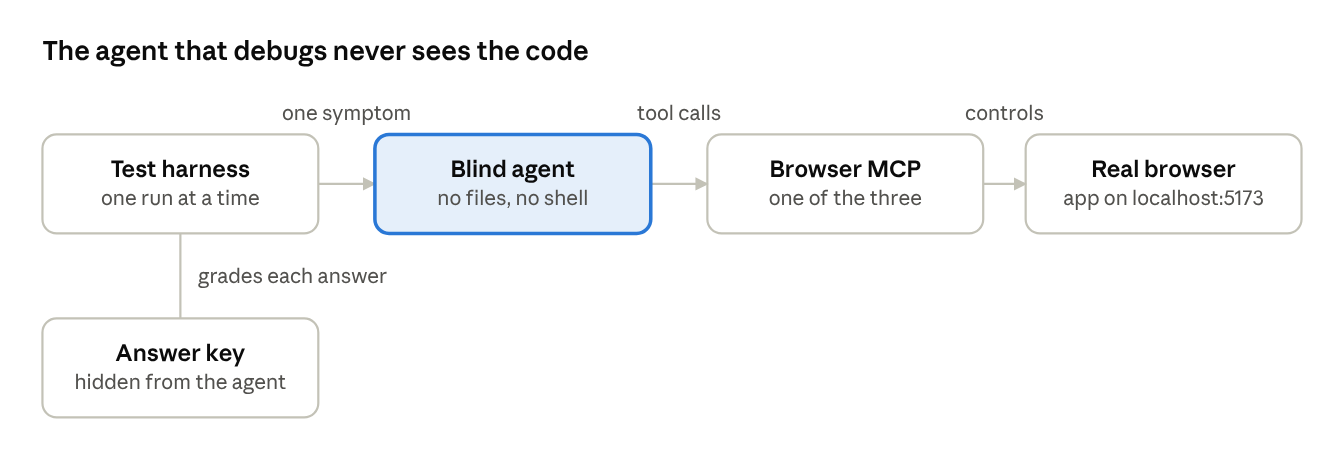
I planned three runs for every browser and bug. Time ran out, so most pairs got one run and a few got two.
Every run that finished named the right cause. Here’s how long each browser took.
| Bug | Chrome | Firefox | Safari |
|---|---|---|---|
| 1. Network waterfall | 123 s (1 run) | 59 s (1 run) | 108 s (2 runs) |
| 2. Layout break | 104 s (2 runs) | 78 s (2 runs) | 86 s (1 run) |
| 3. Console error | 68 s (1 run) | 67 s (2 runs) | 82 s (1 run) |
Where a pair has two runs, the number is the middle of the two. Each run cost between $0.18 and $0.36, by Claude Code’s own estimate.
CardRow.tsx, and quoted the loop back to me. No timing math neededCardRow.tsx through evaluate_javascript. Remember that. A browser with no source tool can still read sourceSo for everyday bugs, use the browser where the bug shows up. With one or two runs each, I wouldn’t bet my money on a 20-second gap.
The first round looked like a blowout.
| Browser | Result | Time | Turns | Total tokens |
|---|---|---|---|---|
| Firefox | Exact cause | 76 s | 13 | 225,095 |
| Chrome | Right area, wrong detail | 398 s | 26 | 500,693 |
| Safari | No answer |
Firefox’s developer preset has three tools the other two lack: enable_debugger, list_scripts, and get_script_source. The agent used them to read AppContext.tsx, ActivityTable.tsx, and NotesBox.tsx. Nine turns in, it said: “Found it. Let me verify the number of activity rows and confirm the mechanism.”
Its answer was exact. The rows are wrapped in memo. They read a context that also holds the note text. A context update goes straight past memo. It even counted the damage: 16,500 Intl formatters built on every keystroke, at about 228 ms each time. It did what you’d do. It stopped guessing and read the code.
Chrome’s MCP has no tool named for reading source. The agent could have fetched the file through evaluate_script. But it didn’t. It walked React’s internal fiber tree by hand instead.
Then it started a performance trace, typed into the notes box, and the tab died:
MCP error -32000: Connection closed
The agent’s reply is my favourite line of the whole test: “Page crashed during trace. Let me reopen and measure differently.”
It did, and it found the shared context. Then it blamed the table for not being wrapped in memo, and marked its confidence as high. But the rows are already wrapped in memo, and context walks right past it. If I’d trusted that answer, I’d have added a memo that changes nothing.
Safari’s first run stalled. A script it ran to time a keystroke hit a 30-second limit, and the run ended with no answer.
Then I got a second look by accident. My test of a separate React CLI broke (more on that below), and those runs fell back to plain browser tools. They’re messy runs. The agent was told about a CLI that wasn’t there, and it lost a few turns hunting for it. But the browser tools were the same.
| Browser | Messy runs | The memo detail |
|---|---|---|
| Firefox | 134 s and 190 s | Right both times |
| Chrome | 223 s | Wrong |
| Safari | 189 s and 244 s | Wrong once, not mentioned once |
So Safari can find this bug. It walked the fiber tree like Chrome did, hit the same 30-second timeout in one run, and kept going.
Put both rounds together and the picture changes. The 76 seconds against 398 seconds was a lucky pair. Firefox was still quicker on the whole, but nowhere near five times.
The gap in accuracy is the one that held. Firefox read the source and got memo right in all three runs. Chrome and Safari read React’s internals and got it wrong in three of their four answers.
So my theory was half right. The browsers aren’t blind to React. They’re blurry.
The React team now ships react-devtools-cdt-mcp. You add one import before React loads:
import 'react-devtools-cdt-mcp/register';
It’s Chrome only. Its README lists 12 React tools, such as the component tree, owner stacks, and a profiler. The agent reaches them through two extra tools on Chrome’s MCP. I ran bug 4 again on Chrome with it turned on. This was version 0.1.0, and one run.
| Setup | Answer | Time | Total tokens |
|---|---|---|---|
| Chrome alone | Right area, wrong detail | 398 s | 500,693 |
| Chrome with the React tools | Exact | 144 s | 493,518 |
| Firefox alone | Exact | 76 s | 225,095 |
The React tools did two things for Chrome. They cut the time by more than half, with no crashes. And they turned a blurry answer into an exact one.
The profiler counted 13,606 components rendering again on every keystroke, at roughly 180 to 330 ms each time. The agent named Memo(TableRow) as a reader of AppContext, and said the update goes past React.memo.
They didn’t cut the tokens. One reason is that the profiler’s commit report came back at 2.1 million characters, and the agent could only read the top of it.
So this is the React layer I expected to need. It just isn’t the only way to a sharp answer. Firefox reading the file got there with half the tokens.
I also meant to test agent-react-devtools, the community CLI that works with any browser. My harness never put its command on the agent’s PATH, so every run got command not found. That’s my bug, not theirs, so I’ve left it out of the results. Its only gift to this article is those messy runs.
| If the bug is | Reach for | Why |
|---|---|---|
| Network, layout, or console | Whichever browser shows the bug | All three found these, and the times were close |
| A React re-render, in dev | Firefox with --tool-preset developer |
It reads the source with a named tool, and it was the only bare browser to get memo right |
| A React re-render, and you live in Chrome | Chrome plus react-devtools-cdt-mcp |
You get an exact answer with real render counts. Without it, Chrome was slow and got memo wrong twice |
| Only broken in Safari | Safari’s MCP | It’s the only one of the three that runs WebKit, and the cheapest to keep connected |
get_script_source. Chrome without the extra flag has no React tools. Both defaults hide the exact tool that won this testAgent debugging stopped being a Chrome-only trick this year. Three engines ship it now, and they aren’t equal. The gap just wasn’t where I expected.
All three can find everyday bugs. All three can even find a React re-render bug. What separates them is how sharp the answer is. The sharp answers came from an agent that could read the code, or from React’s own tools. The blurry ones came from an agent guessing at React’s internals.
So before you add anything to your loop, check two things. Can your agent read the source of the page it’s debugging? And are the good tools switched on?
Then keep a human around. Somebody still has to check the answer and choose the fix.
React 19.3 and modern CSS make several common patterns unnecessary. Here are 10 features that let you delete old React code and simplify your apps.

Explore the top AI agent frameworks in 2026 and compare how they handle tools, memory, structured output, streaming, and step limits.

Tailwind CSS component libraries provide pre-built components to streamline the process of developing aesthetic, user-friendly interfaces.

Jev is a TypeSafe AI decision model that classifies messages using typed questions. Learn how to use it for routing to reduce unnecessary LLM calls.
Hey there, want to help make our blog better?
Join LogRocket’s Content Advisory Board. You’ll help inform the type of content we create and get access to exclusive meetups, social accreditation, and swag.
Sign up now
 Learn more →