If you’ve ever worked on a web application for businesses or fintech, you would have observed that they often organize data in tables. Datagrids are components that can render data in rows and columns and enable users to perform operations such as sorting and filtering data, exporting data, in-cell editing, pagination, etc.

Grids are data-driven and are built to handle high-performance business web applications. They have this spreadsheet-like user experience and can be customized to build complex, scalable, and data-rich interfaces.
In this article, we’ll be outlining why datagrids are important and discussing five JavaScript datagrids that you should consider for your next project.
Datagrids are essential in web applications that render a lot of data such as live reports, tracking stats, and so on. Here are some of the reasons why you should choose a datagrid for your next application:
Having seen some of the importance of using a datagrid, let’s take a look at some of them.
React Table is a headless, open source, lightweight, and extensible data table. By headless data table, it means it does not control how your markup renders or UI elements. This gives you the freedom to theme your datagrid to fit your application requirements.
React Table allows you to use React Hooks to configure your datagrid features such as filtering, sorting, pagination, virtualized rows, in-cell editing, etc.
To add it to your project, install the package with:
npm install react-table
// or
yarn add react-table
Then start building a basic data table with the primary hook useTable. This is what a typical React datagrid will look like with pagination:
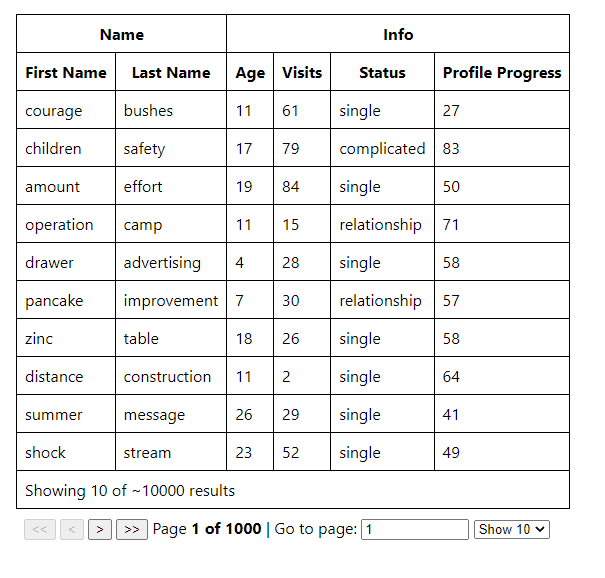
You can check the demo too.
You can integrate React Table into your React application even if you just need to implement pagination using the usePagination Hook. It is a table utility, and you can go ahead to combine these Hooks to build a powerful datagrid for your application.
However, if you’re building a large-scale enterprise application, you might want to consider the time it’ll take your team to build something tangible from scratch.
AG Grid is a complete, feature-packed JavaScript datagrid. It has both community and enterprise versions. It supports the major JavaScript frameworks, including Vanilla JavaScripit, React, Vue, and Angular. It has core features such as selection, filtering, data binding, rendering cells, in-cell editing, master-detail, import and export options, virtual scrolling, keyboard events, testing, and security options.
AG Grid also has other UI components to extend the grid such as sparklines, tool panels, context menus, status bars, and integrated and standalone charts.
To install the open source version to your JavaScript project, run:
npm install ag-grid-community
If you’re working on a React project, you’ll also have to install the ag-grid-react package to access all the React UI components.
This is what a typical AG Grid datagrid will look like:
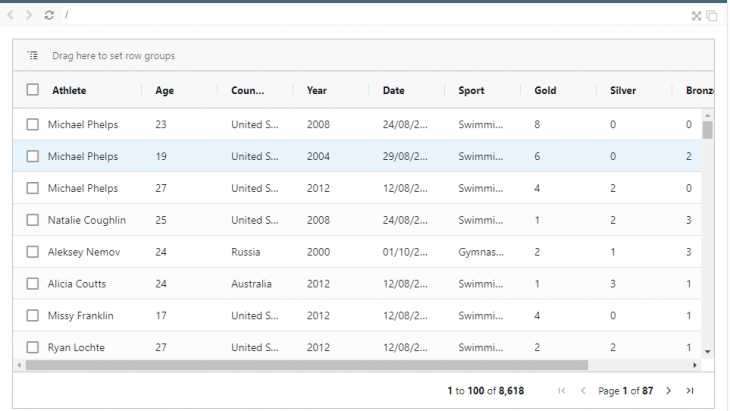
You can check out the basic demo to see how AG Grid works with React.
AG Grid also includes predefined UI themes and gives you the ability to create your own theme. The themes include Alpine (with dark mode), Balham (with dark mode), and Material UI.
However, AG Grid community version features are limited. You’ll need to get the enterprise version to have access to features such as master-detail, integrated charts, sparklines, Excel export, row grouping, aggregation, advanced filtering, developer support, and so on. Nevertheless, if you’re working on a large enterprise project, you’ll want to consider the benefits of using this datagrid and reduce the pain of building one from the scratch.
Grid.js is a free and open source Javascript table plugin built with TypeScript. Grid.js has configurations for data binding, filtering, custom and multi-column sorting, cell formatting, search and pagination, selection, and support for React, Angular, and Vue.
Just like React Table, which we discussed earlier, Grid.js is an advanced utility table plugin. To add Grid.js to your JavaScript project, run:
npm install gridjs
Then import the Grid module and CSS theme to start building:
import { Grid } from "gridjs";
import "gridjs/dist/theme/mermaid.css";
Also, while React Table works with hooks, Grid.js works with configurations. Configurations are attributes you pass to the Grid instance such as search, sort, pagination, style, etc. If you’re working with any of the JavaScript frameworks, Grid.js has recommended wrapper packages for each of the frameworks.
For example, if you’re working with React, you’ll have to run npm install gridjs-react and also have gridjs installed because it is a core dependency for the wrapper to work:
<Grid
  data={[
    ['John', '[email protected]'],
    ['Mike', '[email protected]']
  ]}
  columns={['Name', 'Email']}
  search={true}
  pagination={{
    enabled: true,
    limit: 1,
  }}
/>
Grid.js is not opinionated with styling, so you can go ahead to integrate your own theme to build a more sophisticated data table.
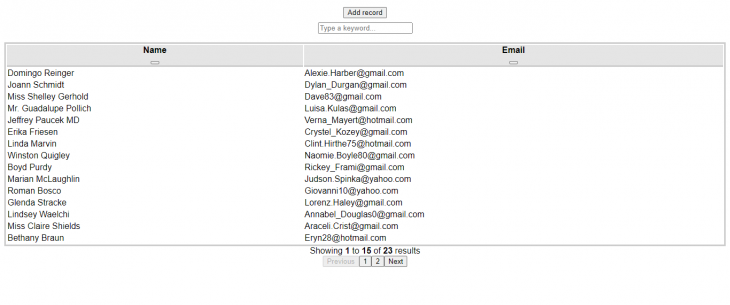
You can check out the demo.
However, Grid.js isn’t great for enterprise applications because it doesn’t have native support for features such as in-cell editing, virtual scrolling, exporting options, Excel-like filtering and sorting, etc.
Handsontable is a JavaScript library for building fast and efficient datagrids. It has a free and commercial license and has support for React, Vue, and Angular frameworks. At the core, Handsontable enables data binding (fetching data from a data source and how it’s rendered on the datagrid), saving data locally, middleware, events, hooks, and configurations. Similar to Grid.js, Handsontable configuration options allow you to configure the datagrid to your taste.
To add the package to your JavaScript project, run:
npm install handsontable
Then import the Handsontable module and the CSS theme. If you’re working on a React project, you will have to install the Handsontable React wrapper package @handsontable/react. This is a basic code snippet of Handsontable with React:
import { HotTable } from '@handsontable/react';

const hotData = [
  ["", "Tesla", "Volvo", "Toyota", "Honda"],
  ["2020", 10, 11, 12, 13],
  ["2021", 20, 11, 14, 13],
  ["2022", 30, 15, 12, 13]
];

const App = () => {
  return (
    <div id="hot-app">
      <HotTable
        data={hotData}
        colHeaders={true}
        rowHeaders={true}
        width="600"
        height="300"
      />
    </div>
  );
}
You can check out the demo for a basic sample of how Handsontable works with React.
Handsontable has this spreadsheet-like UI, and it’s best when you want to build a spreadsheet web application with features such as cell functions, types, formulas, context menus, keyboard navigation, internationalization, perform batch operations, etc. However, you are limited with the theming options when you’re using the library.
As a JavaScript developer, you’ve probably come across a Toast UI Grid control, most especially the notification or pop-up control. The Toast UI grid is a pure JavaScript grid control for implementing datagrids. It has features such as complex column operations, a custom editor, theming options, a date picker, validation, sorting, internationalization, data summary, custom events, frozen columns, filters, pagination, and infinite scrolling.
To install Toast UI Grid to your JavaScript project, run:
npm install tui-grid
Then import the Grid module from tui-grid. To start building your JavaScript Grid, create an instance of Grid and pass options to it. Just like with Grid.js, you need to pass config options, calling various APIs to build your Grid.
This is how a typical Toast UI Grid would look:
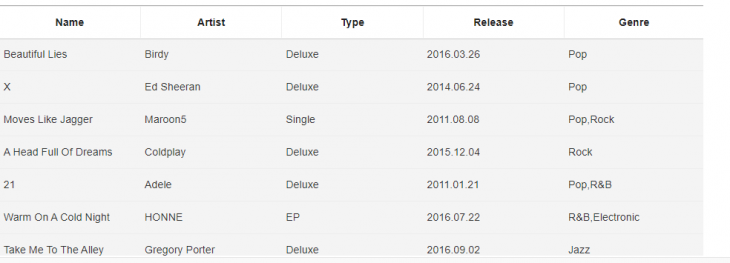
However, the Toast UI grid is just a pure JavaScript grid with no support for other JavaScript frameworks, which is something you might want to consider when you’re about to pick the library for your datagrid needs.
JavaScript datagrids are controls that are better handled by third parties, because they give you lots of functionality and reduce the time spent on building your own datagrid tool. In this article, we discussed why datagrids are important and compared five open source JavaScript datagrids including React Table, AG Grid, Handsontable, Grid.js, and Toast UI. We also highlighted the features and usage of these datagrids.
If you’ve worked with a datagrid that you think should be on this list, please mention it in the comment section.
Debugging code is always a tedious task. But the more you understand your errors, the easier it is to fix them.
LogRocket allows you to understand these errors in new and unique ways. Our frontend monitoring solution tracks user engagement with your JavaScript frontends to give you the ability to see exactly what the user did that led to an error.
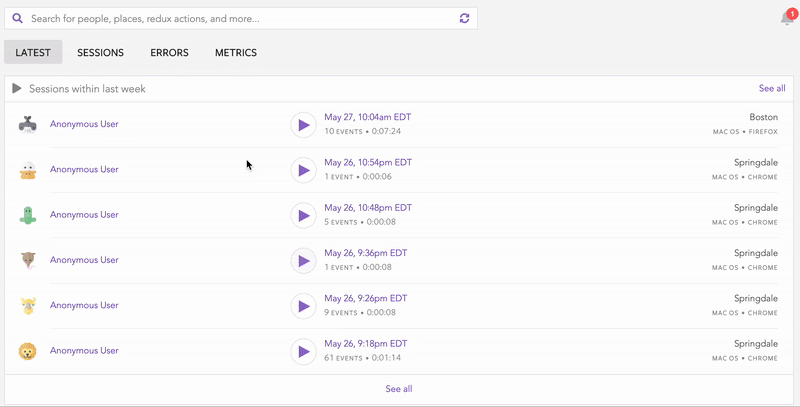
LogRocket records console logs, page load times, stack traces, slow network requests/responses with headers + bodies, browser metadata, and custom logs. Understanding the impact of your JavaScript code will never be easier!
Would you be interested in joining LogRocket's developer community?
Join LogRocket’s Content Advisory Board. You’ll help inform the type of content we create and get access to exclusive meetups, social accreditation, and swag.
Sign up now
A breakdown of the wrapper and container CSS classes, how they’re used in real-world code, and when it makes sense to use one over the other.

This guide walks you through creating a web UI for an AI agent that browses, clicks, and extracts info from websites powered by Stagehand and Gemini.

This guide explores how to use Anthropic’s Claude 4 models, including Opus 4 and Sonnet 4, to build AI-powered applications.

Which AI frontend dev tool reigns supreme in July 2025? Check out our power rankings and use our interactive comparison tool to find out.
2 Replies to "5 open source JavaScript datagrids for your next project"
There is a JavaScript data grid component to handle large database records worth mentioning: https://jspreadsheet.com. Their example creates a table from an array with 100 columns x 50000 rows (five million cells) in less than one second.
If your project is growing and you need powerful data grid, consider trying Flexmonster: https://www.flexmonster.com/demos/js/pivot-table/.
Its pivot table component with both a flat view and pivot grid, packed with an impressive set of feature.