We would have fewer unused products on the market if most product owners paid attention to user experience and usability testing. They think about it, but most designers and product owners believe it’s too expensive and may require more funds and a larger workforce to do so.

What if I told you there was a way to conduct usability testing without spending a fortune or requiring a large team? Would you give it a shot? Let’s dive into the world of the System Usability Scale.
If you’re a designer or product owner aiming to determine usability levels, you should consider using the System Usability Scale.
Developed in 1986 by John Brooke, the System Usability Scale is a ten-question template that is used to provide assessments of usability. Before being spread out to other parts of technology, the System Usability Scale was first used in systems engineering.
The original idea was to measure the usability of the engineering systems. In modern times, the System Usability Scale is used to measure efficiency and effectiveness through usability.
The System Usability Scale (SUS) is a reliable “quick and dirty” tool for measuring usability. It comprises a ten-item questionnaire with five response options for respondents, ranging from strongly agree to strongly disagree. It allows you to evaluate various products and services, such as hardware, software, mobile devices, websites, and applications, and is not limited to only website usability.
The System Usability Scale is beneficial to product owners and designers because:
That’s why we still use the System Usability Scale. If you want to gauge customer sentiment, it’s cheap, easy, and reliable.
Let me show you how the SUS works in action.
The System Usability Scale (SUS) implementation process entails a series of steps to effectively measure and evaluate the usability of a system or product. As an organization, you can gain valuable insights into user perceptions and identify areas for improvement by following this process. Remember that this is a template; you can adjust it to fit your organization.
If you are hearing about SUS for the first time, the first step would be to begin by learning about the SUS’s history, purpose, and structure. Examine the original SUS questionnaire, and take notes if there may include areas you would want to modify.
The next step would be to determine the mode of administering the SUS. The SUS can be delivered through paper-based questionnaires, online surveys, or software integration. Choose the best method for your resources, target audience, and research goals.
Plan the overall protocol for usability testing. Determine the tasks or scenarios participants will complete, the sample size, and the recruitment process. Ensure that the usability testing protocol aligns with the study’s goals and provides enough data to evaluate usability effectively.
The SUS may need to be modified in order to better suit your system or target users, depending on your unique needs and context. Maintain the validity and reliability of the scale, and make sure any modifications are supported by research.
If you have successfully gone through the steps mentioned above, you can go ahead and set the date, invite the users for testing, and start the test. During the usability testing sessions, give the participants the SUS questionnaire.
The SUS is typically administered after the testing session to capture overall impressions of usability. Give participants clear instructions on how to rate each item, and make sure they understand the scale.
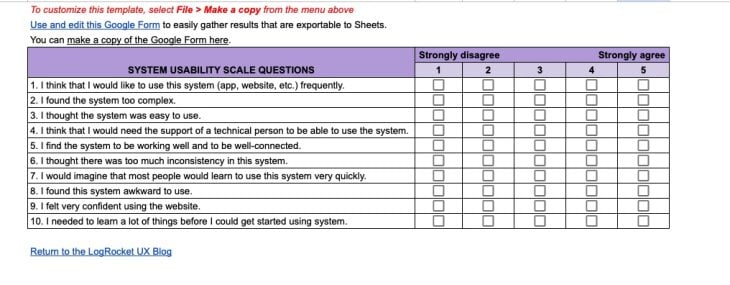
To make things easier on you, we’ve made a template with the questions for the System Usability Scale, a Google Form to copy to send to users, and a sheet to calculate your SUS.
Download the System Usability Scale here.
Here’s a hypothetical case study of how the System Usability Scale can be applied to a product: a financial institution recently launched a mobile banking application to provide convenient and user-friendly access to banking services.
The institution has, however, received user complaints about the app’s usability. Users need help navigating the interface, have confusion with certain features, and are frustrated with error messages. The institution decides to use the SUS to conduct a usability evaluation and identify pain points and improve the user experience.
The first step is to set up a usability testing team if the organization does not already have one. In a more organized company, the research is done by the design team, composed of UX researchers and designers.
This team decides on the study’s objectives, the sample size, and the tasks participants will perform during the testing session. The team decides to bring in twenty existing customers with varying experiences with mobile banking applications.
The participants are placed in a controlled testing environment and asked to complete a series of tasks using the mobile banking application. These tasks could range from transferring funds between accounts to reviewing transaction history and setting up recurring payments. The team observes participants’ interactions, notes their difficulties, and documents any usability issues.
The SUS questionnaire is administered after the participants complete the usability tasks. Participants rate their agreement with usability statements like, “I found the mobile banking app unnecessarily complex” and “I felt confident using the app to perform banking tasks.” Participants rate each statement on a five-point Likert scale.
The team collects and analyzes SUS response data. They compute each participant’s SUS score by averaging their ratings across the ten items. The team also goes over the qualitative feedback provided by test participants, paying particular attention to specific pain points and areas for improvement mentioned in their comments.
The team identifies the pain points that users experienced with the mobile banking app based on SUS scores and qualitative feedback. They noticed several participants expressed difficulty locating specific features, confusion with the app’s terminology, and frustration with error messages that needed clear explanations.
Following the above case study, this is how the scoring of the above usability test should go;
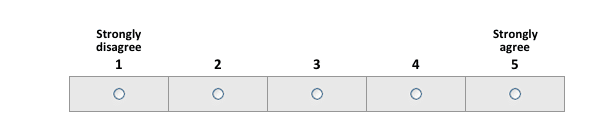
On a five-point Likert scale, participants rate their agreement with each of the ten SUS items, ranging from strongly disagree to strongly agree. The scale is represented by the following:
Assign numeric values to the Likert scale responses to make score calculation easier. We can use the following numbers:
For calculating SUS scores, we follow these steps for each participant:
For instance, suppose a participant’s responses were as follows:
The calculation would be:
So the SUS score = 33 * 2.5 = 82.5
Following that, we interpret the SUS scores ranging from 0 to 100:
Testing and validation are essential to ensuring the validity and dependability of any updates or improvements. Here are some ways I would raise the usability scale of the current system:
By simplifying the questionnaire’s language, you can make it more accessible to a broader range of participants, ensuring that their feedback is accurately captured.
The current questionnaire of the SUS, as simple as it looks, may be quite tricky for non-English speakers or those with low English proficiency. For instance, one question on the SUS is, “I find the system functioning smoothly and is well integrated.” It can be reworded for simplicity as, “I find the system to be working well and to be well-connected.”
The SUS comprises ten question items. One method for improving the SUS is to include a wider variety of question items covering other usability aspects. Things such as accessibility, mobile responsiveness, speed, task efficiency, and learnability could be included.
Since the initial design was made for engineering systems, an update could be made for its current use. An example of a question that reflects accessibility and responsiveness is, “I find the system easy to use on all devices.”
Including more open-ended questions can yield qualitative insights. Incorporating prompts for users to provide specific feedback, suggestions for improvement, or examples of their experiences can improve usability evaluations and offer deeper insights into user perceptions.
For example, ask “what” questions like, “What would you change about this system?”
Usability testing is done in various cultural and demographic contexts. Adjusting the SUS to account for cultural and demographic differences can help ensure its applicability and accuracy across user groups. Additions of illustrations or graphics would be a significant improvement on this.
Finally, usability assessment tools such as the SUS should be treated as living documents that evolve in response to user needs and technological advancements. Collecting feedback from users, usability professionals, and researchers on an ongoing basis can provide valuable insights into how to refine and improve the SUS over time.
The above suggestions refer to website product testing, not system engineering. You can download the system usability scale here.
Normalizing your score to a percentile rank is the best way to interpret it. Scoring can be difficult to interpret. To convert the original scores of 0–40 to 0–100, the participant’s scores for each question are converted to a new number, added together, and multiplied by 2.5.
Despite the fact that the scores range from 0–100, they are not percentages and should only be considered in terms of their percentile ranking. The average score on the System Usability Scale is 68. If your score is less than 68, there are likely serious usability issues with your website that you should address. If your score is higher than 68, you are good to go.
Each participant rates the SUS’s ten items on a five-point Likert scale ranging from strongly disagree to strongly agree. To determine the SUS scores, add the ratings for the odd-numbered items (1, 3, 5, 7, 9) and subtract the ratings for the even-numbered items (2, 4, 6, 8, 10). To get a value between 0 and 100, multiply the score by 2.5.
Begin by looking at each participant’s SUS score separately. Higher ratings indicate better-perceived usability, while lower ratings indicate areas for improvement. Examine the scores for patterns and outliers to identify common trends or extreme user experiences.
If available, compare the mean SUS score to established benchmarks or a baseline from a previous evaluation. This allows you to compare the system’s performance to industry standards or previous iterations. A higher score than the benchmark indicates better usability, whereas a lower score indicates room for improvement.
The system’s usability strengths and weaknesses are based on SUS scores, benchmark comparisons, standard deviation, and qualitative feedback. Concentrate on areas with lower scores, higher variability, or user feedback consistently highlighting challenges or frustrations. These are the primary pain points and opportunities for improvement.
Using the identified strengths and weaknesses, make actionable recommendations to improve the system’s usability. Prioritize the recommendations based on the severity and impact of the pain points and the ease with which the changes can be implemented. Consider design changes and any necessary changes to the system’s functionality, terminology, or navigation.
An overview of how your scores should compare is provided below:
The System Usability Scale is a useful tool for assessing system and product usability. As an organization or individual, you can gather meaningful data and insights to improve user experiences by following the SUS implementation process. You can also enhance the overall usability of your systems and products by iterating and incorporating user feedback continuously, increasing user satisfaction and engagement.
The System Usability Scale is not diagnostic and will not tell you which specific problems you face, but it will give you a red or green light to know how badly your usability needs work.

LogRocket's Galileo AI watches sessions and understands user feedback for you, automating the most time-intensive parts of your job and giving you more time to focus on great design.
See how design choices, interactions, and issues affect your users — get a demo of LogRocket today.
Multimodal UX goes beyond designing for screens. Learn how context-aware systems, progressive modality, failover modes, and accessibility-first design create better digital product experiences.

Learn how context-aware mode prioritization and seamless transitions improve multimodal UX and reduce mode confusion.

Research is becoming more democratized, product cycles are accelerating, and AI is transforming synthesis and ResearchOps. Here are the three trends shaping UX research in 2026.

Voice support is not the same as multimodal UX. Here’s how to design systems with true mode continuity and context-aware interactions.


