Feature comparison charts are a common way to show how your product stacks up against competitors, but they often do more harm than good. When used in the wrong context — like with uninformed users, emotionally driven buyers, or crowded markets — they can confuse, overwhelm, or even send users straight to your competitors.
This blog breaks down the situations where comparison tables fall flat, why they can damage your UX and conversions, and what to use instead.
From use-case storytelling to emotional design, we’ll show you more effective ways to communicate your product’s value — and when comparison charts might actually make sense.
Not sure when to use a comparison chart?
I’ve also built a freely downloadable checklist — with red and green flags to guide your decision and help you avoid common UX pitfalls.
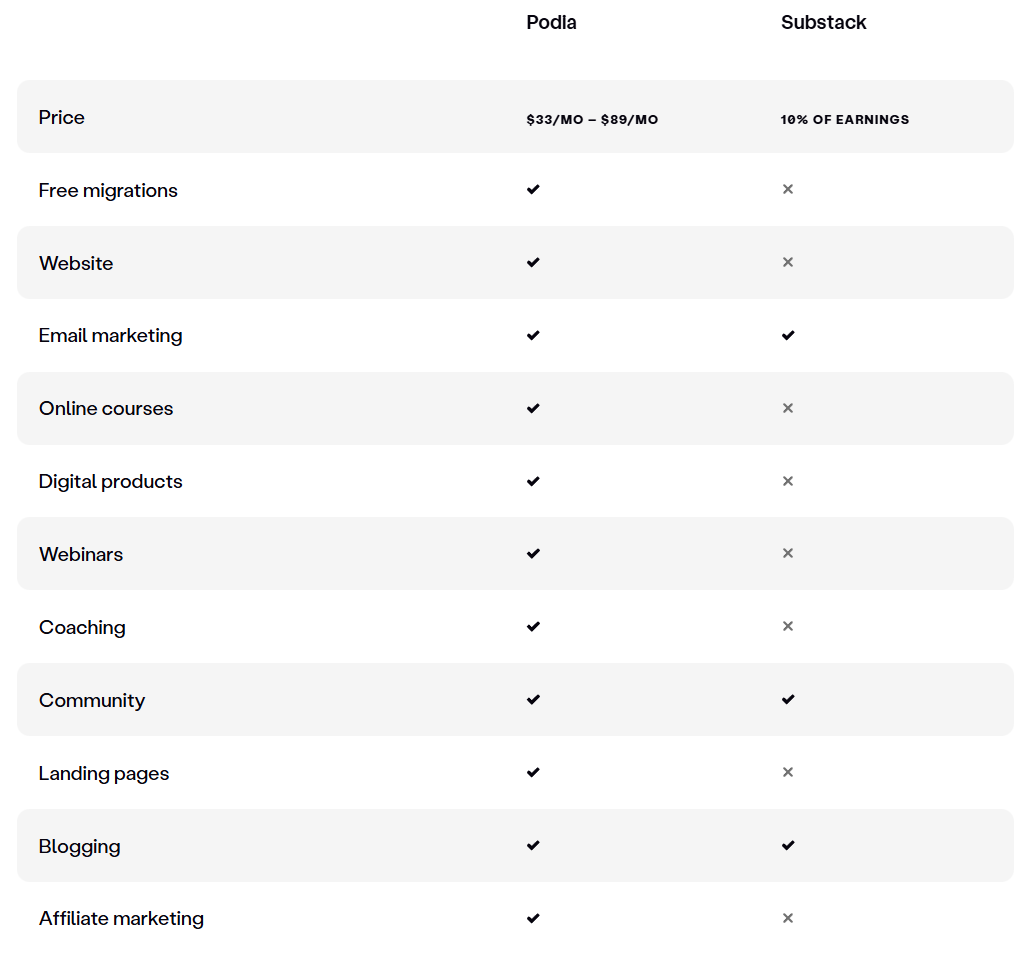
Feature comparison charts — charts that compare your product to competitive alternatives — are a common element of UX and marketing design. They are straightforward, informative, and at their best, showcase how your product wins over competitors and help users make informed decisions faster.
Look at this example:
However, when used in the wrong context, these charts can backfire and actually confuse users and ruin your conversion rates.
To be frank, the more experience I have in conversion-oriented design, the bigger an antifan of feature comparison charts I become. Don’t get me wrong, there are situations in which they work pretty well, but in most cases, there are better alternatives available.
Let’s take a deeper look at these cases.
There are many situations in which you should avoid feature comparison charts in your design:
To understand a feature comparison chart, users have to understand what they are comparing. That’s not the case if they don’t fully understand what the product is about.
If your product is novel, and you get your traffic from low-intent sources, then the feature comparison chart only adds further confusion.
Better alternative
For products that are not established, focus on use-case storytelling. A headline such as “a customer management software for freelancers working with ten or fewer clients” explains what the product is about and who it is for better than any comparison table.
Exception
A feature comparison table can work for new products if there’s an established market leader.
For example, if you are building a new UI design tool, benchmarking it to Figma could give a quick snapshot of both what you are and, most importantly, why you are different.
Comparing your product to competitors doesn’t make much sense if they are better in most areas. Even more, a feature comparison table is still risky if competitors are better in 2 out of 10 key features. The odds are that these two features are very important to some users.
Better alternative
Focus your communication on your competitive edge. Think of the one key strength you invest in to win the market. If you are easiest to use, go all-in on that. If you are fastest, remind them often.
If you can’t outperform industry leaders, which is often the case, focus on niching down on that one thing you are great at.
Exception
It could make sense to select only the features you are better at for the comparison table. For example, instead of comparing all features, compare only the two you are better at.
It could work if your product is all about these specific features. Otherwise, this approach is rather sketchy.
Not all features and capabilities are obvious to non-users. For example, listing “AI Scorig” or “Smart Routing” might sound impressive, but to whom? How does a product with smart routing differ from one without it?
If the things you compare aren’t obvious at first glance, you are just introducing noise.
Better alternative
Focus on describing your innovative features and capabilities. Instead of explaining that “you have them and others don’t”, focus on educating on what these actually are.
Exception
If you work with a very technical audience that not only understands these details but also cares about them, then such a table might make sense even for complex capabilities.
Most of the time, we first make the decision based on emotions, and then we justify it with logic and sound arguments. That’s simply how the human brain works.
The problem with comparison tables is that they don’t spark emotion. They are bland and fact-focused, while most potential buyers are emotionally driven.
Better alternative
Focus on emotional design principles. Add vivid pictures, social proof, and testimonials to further build a compelling promise that sparks emotions.
Exception
Feature comparison tables might make sense further in the funnel, once users have already emotionally decided they want to buy and intuitively seek logical arguments to justify their choice.
The main premise of the feature comparison table is to show how you differ from or are better than competitors. But that partly assumes that users know what the alternatives really are.
If they are unaware, not only are you adding noise, but you are even encouraging users who may have even thought you were the only solution to explore and compare other options.
Alternative
Focus on highlighting your product value proposition and what use cases you serve. Comparing to competitors shouldn’t be your main selling point.
Exception
If there’s a big established competitor that has many issues and many people actually hate it, but use it because it’s “the most credible” (think Jira, Salesforce), then using it as a comparison point might help you make a compelling point.
If there are more than three viable and well-known competitors, you are introducing an information overload. When people are forced to compare numerous options, they often get paralyzed by the paradox of choice and don’t make any decision.
Alternative
As earlier — focus on the value your product provides and who it is for, not on who you compete with.
Exception
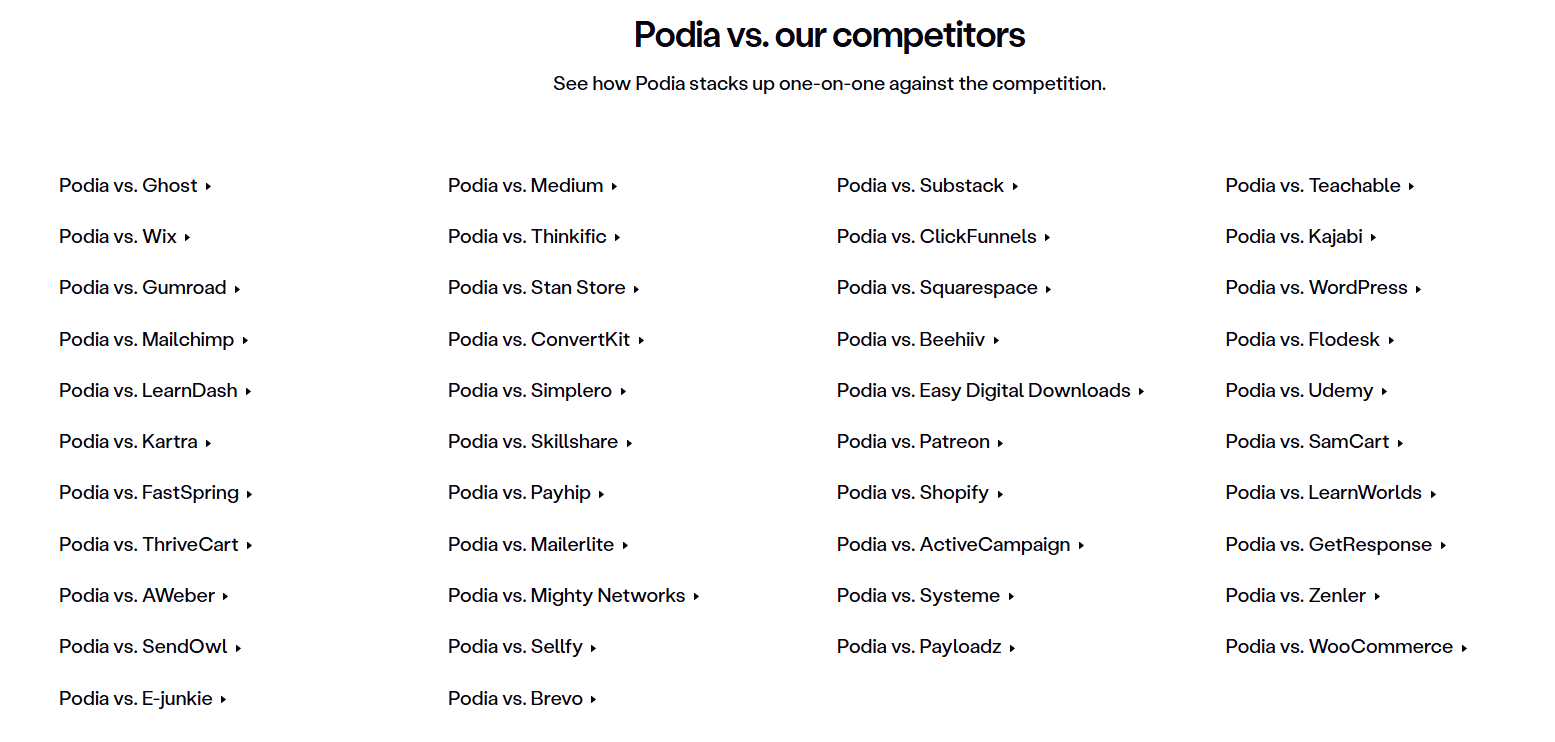
If people often search “X vs Y” or “product X alternative” on search engines, it might make sense to create numerous dedicated subpages focused on a single competitor comparison to get some traffic.
If your product is very complex and offers numerous critical capabilities, just like Jira, then a comparison table will quickly get overwhelming.
Alternative
Complex products work best when explained in simple terms. Why do you have so many features? What problem does it solve and how? Explore ways to explain that to a layman. It’s great that you have fifty features, but instead of showcasing them upfront, focus on progressive disclosure.
Exception
If your target audience is very detail-oriented and cares about specific features, consider creating a collapsible comparison table, which is a table in which:
Lastly, comparison tables need maintenance. If you and your competitors evolve a lot, you’ll need to update the table frequently. And let’s be honest. Things like that slip.
It might lead to accidentally undercommunicating your current value, or even getting sued for misinformation, if your table no longer represents the factual state.
Alternative
Either have a dedicated person to regularly monitor changes and update the table, or just drop it.
Way too often, designers add comparison tables because “they look nice”. Yeah, a comparison table is a great way to enhance UI and fill up empty space, but the important question is, does it get the job done? Does it help users make decisions quickly, and does it boost sales?
Based on my experience optimizing funnels, product pages, and landing pages for a couple of years, they don’t usually work.
They just present your product from a too generic perspective and are more complex to grasp than a well-thought-out headline or two.
I only find three main use cases when they work:
In other cases, although there are viable alternatives to using those tables, such as moving further in the flow, making them expendable, focusing on key features, and so on, they seem not to add much value.
| Use a comparison chart when: | Avoid one when: |
| Your product strategy is built around one key competitor. | You’re early in the user journey and need to educate or inspire. |
| Your users are technical and detail-focused. | You’re weaker in several important areas. |
| Your audience is late in the funnel, looking for logical justification. | You’re comparing too many features or competitors. |
As always, although my experiences with feature comparison tables haven’t been great so far, it doesn’t mean they won’t work in your context. It’s still a viable test to run. I just wouldn’t prioritize it very highly to be fair.
Not sure when to use a feature comparison chart in your design?
Download my free checklist — it’s packed with clear red and green flags to help you decide if a comparison chart is the right fit for your product. Whether you’re early in the user journey or dealing with multiple competitors, this checklist will guide you toward the best approach and ensure your design choices work for your users.
Get it now and start making smarter, more informed UX decisions!

LogRocket's Galileo AI watches sessions and understands user feedback for you, automating the most time-intensive parts of your job and giving you more time to focus on great design.
See how design choices, interactions, and issues affect your users — get a demo of LogRocket today.

When AI made generating design concepts almost effortless, I realized the most valuable part of a critique was no longer the interface itself. It was understanding the context, tradeoffs, and judgment behind the final design. Here’s how AI has changed the way I run design critiques—and why I think that’s making them better.

The Double Diamond design process helps UX teams balance exploration with decision-making, guiding projects from problem discovery to solution delivery. Learn how each phase works, which tools to use, when the reverse Double Diamond makes sense, and why the framework remains relevant for modern product development.
Explore the core principles of GUI design and learn how consistency, simplicity, feedback, accessibility, and user testing contribute to better digital experiences.

After five years in UX, I revisited the Daily UI challenge to reconnect with hands-on design. Along the way, I learned that great interfaces come from thoughtful briefs, sound judgment, and user feedback, not just better AI tools.


