The center of gravity of the modern application stack is shifting toward the frontend. Demand for rich and performant user interfaces, highly scalable infrastructure, and increased developer productivity has led product and engineering teams to deploy new application architectures.

Whereas monolithic backends once held the majority of application logic, today, we build stateful single-page frontends that communicate with disparate microservices, serverless functions, smart CDNs, and third-party APIs.
While this shift has undoubtedly improved end-user experience and application availability, it has introduced a new set of challenges to the way we monitor our applications.
Understanding performance in web apps is hard. Between slow API calls, heavy client-side JavaScript, and complex user flows, there’s a constant struggle to ensure your application performs well and offers an excellent experience for your users.
And while performance issues are sometimes reported by users or caught in QA , most problems are never actually reported since users who have a bad experience just leave or suffer in silence. Even when a problem is known, it’s difficult to gauge its impact on your user experience and the aggregate impact on business metrics like conversion rates or NPS.
Traditional APM tools like New Relic, Dynatrace, and AppDynamics only solve part of the problem. Originally designed for monitoring monolithic server-side apps, they later added browser SDKs as frontends grew more complex.
While these tools are useful for monitoring backend systems (infrastructure, services, databases), their frontend telemetry is limited, focusing mostly on page loads, resource timings, and JavaScript errors. Many teams find that their alerting is too noisy (too many false positives to be useful) and that they don’t capture enough context to help them understand the actual impact of technical issues on the end user.
Monitoring frontend and backend applications are very different processes. In the days of monolithic backends serving “multi-page apps,” performance was primarily a function of initial page loads. By optimizing these, we could make our applications feel faster and hopefully improve important business metrics like conversion rates.
In modern single-page apps, performance is affected by a host of factors, including network requests, JavaScript execution, local resource access, CPU load, and memory usage. Slowness can be introduced from the backend, CDN layer, internet connectivity, JavaScript performance, or client device (iOS, Android, browser, etc.).
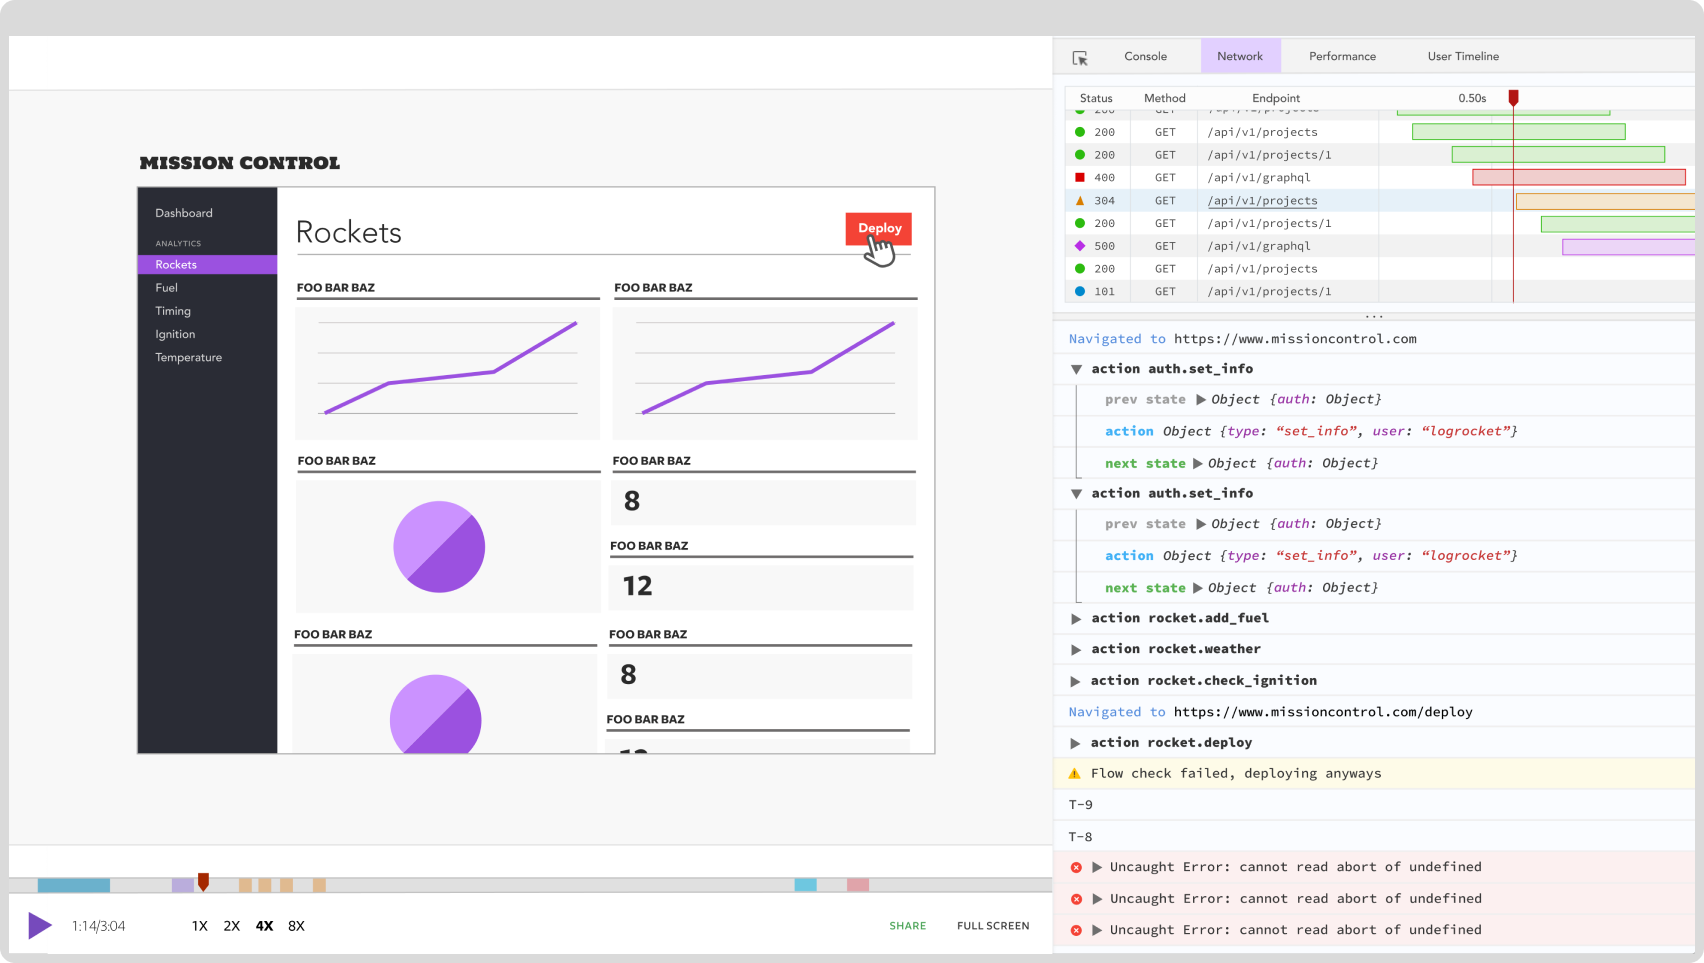
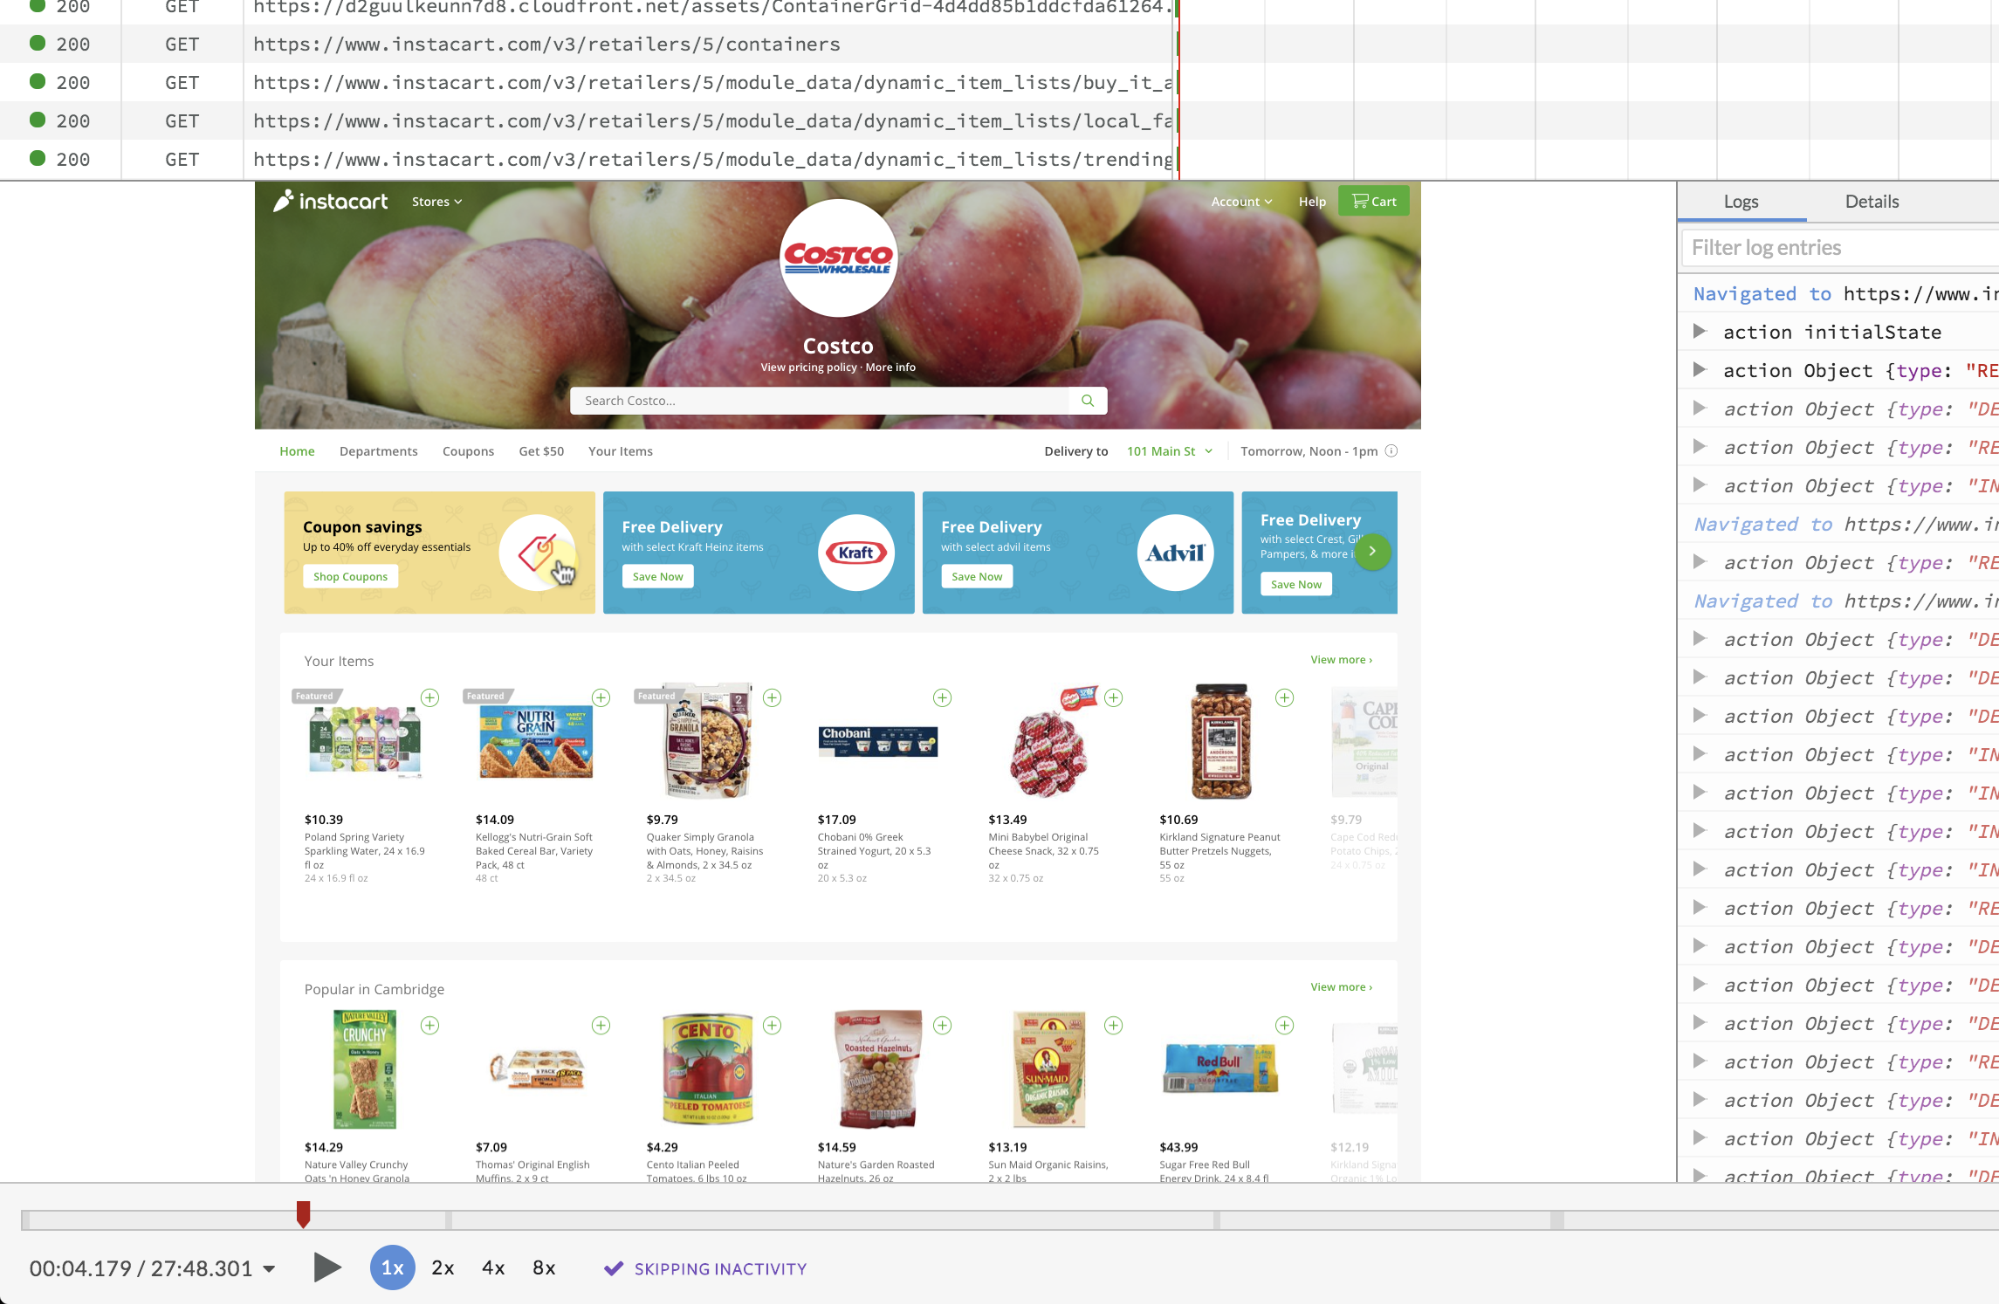
When we started LogRocket three years ago, we set out to build the ultimate tool for frontend debugging. When a user reports a problem, LogRocket shows you a video replay of exactly what they saw, alongside network logs, JavaScript errors, console logs, and application state to understand what went wrong.
But since (nearly) the beginning, we’ve known that the data we collect could yield deeper insights. Tooling to debug problems reactively will always be important to developers’ workflows — but ideally, the right monitoring stack can help you proactively understand performance problems and their impact on your users.
That’s why today, we’re incredibly excited to announce LogRocket Metrics, our first step toward a frontend APM solution that directly helps you understand and improve your application’s performance.
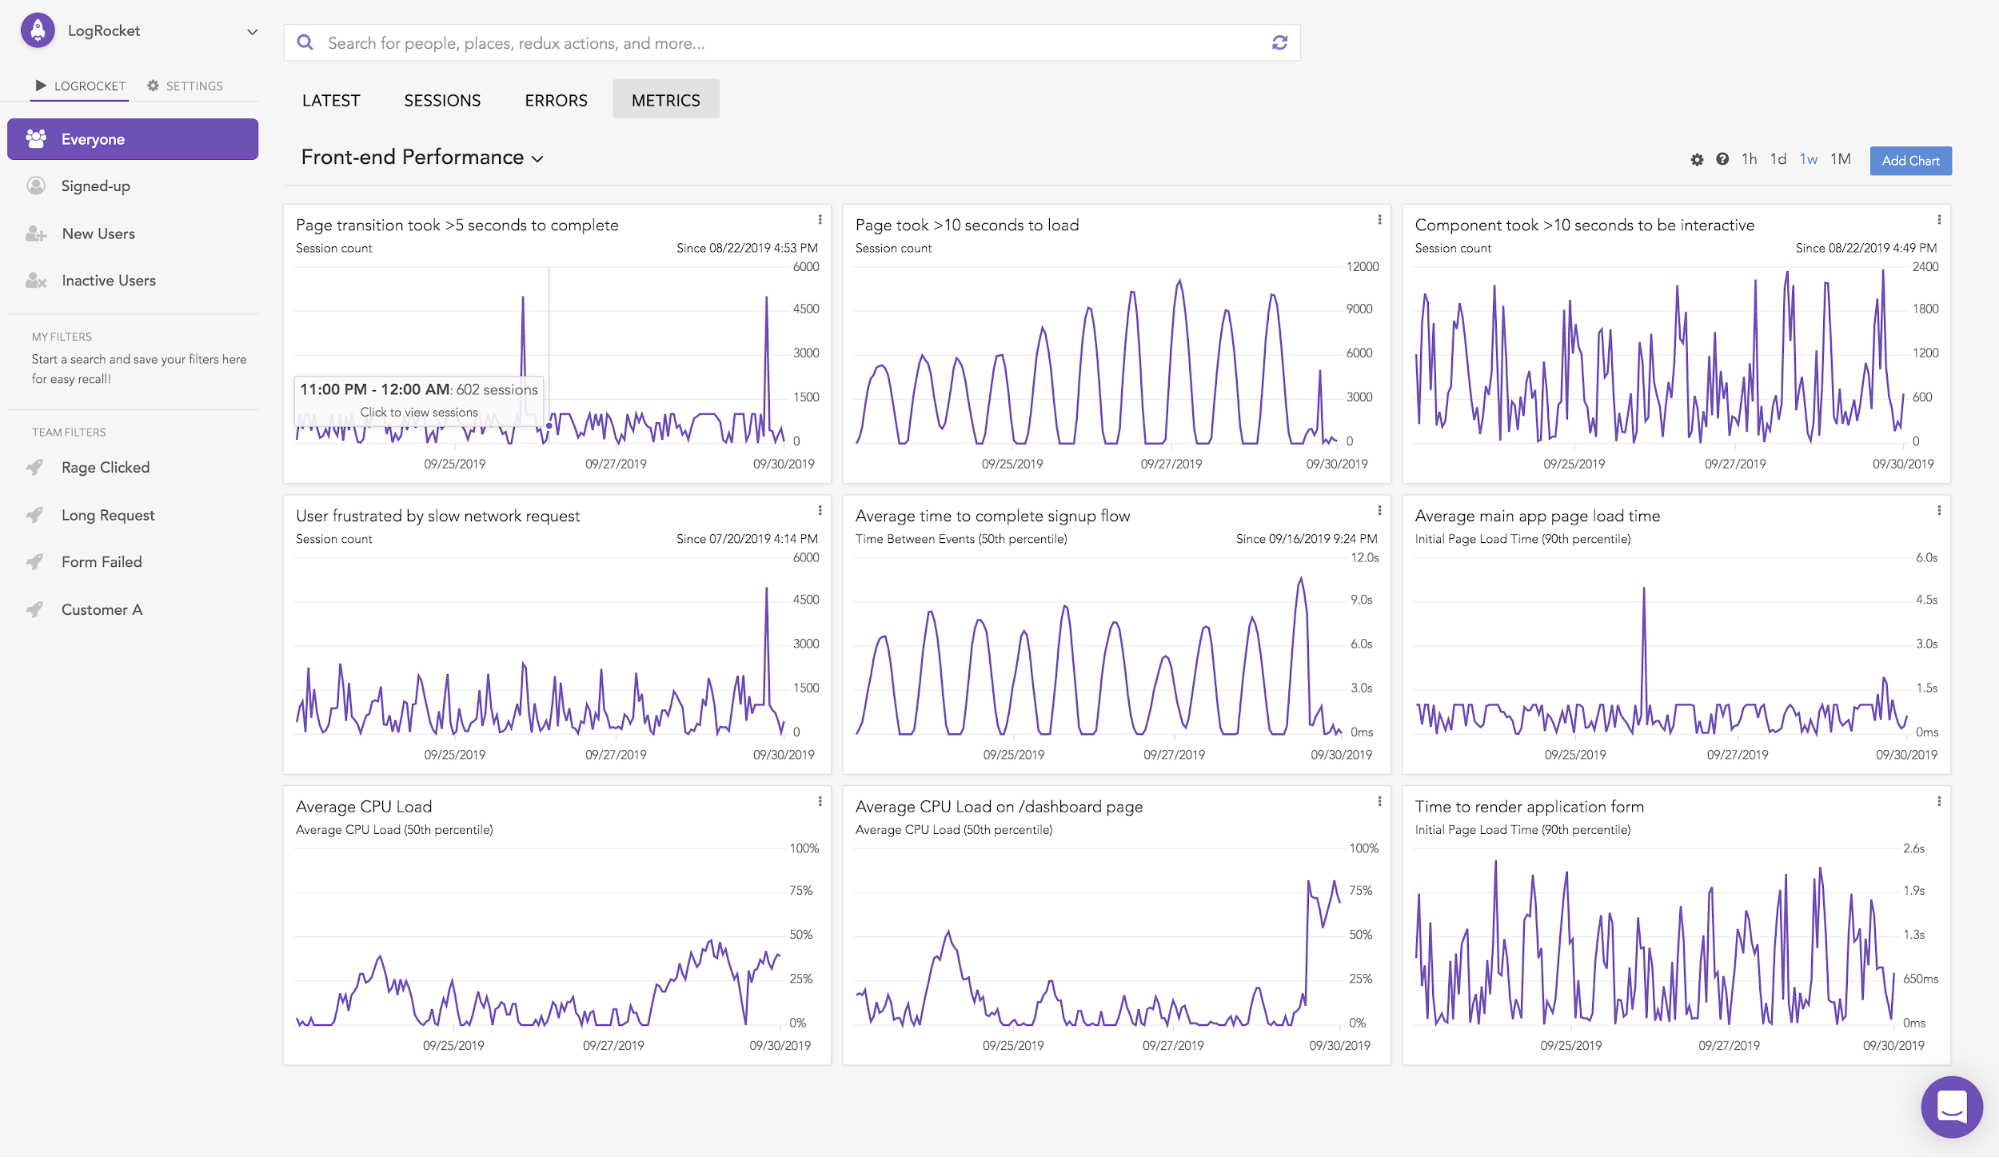
LogRocket Metrics ties together session replay and APM in an easy-to-use dashboarding tool that anyone on your team can use, regardless of technical ability.
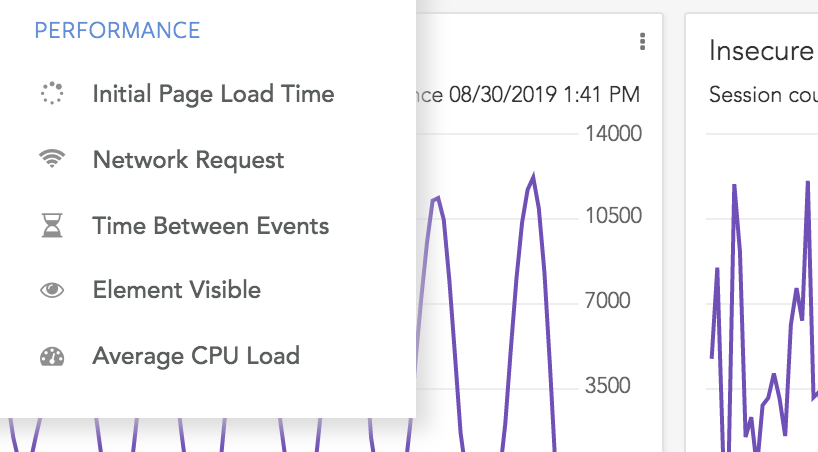
LogRocket now captures CPU usage, memory usage, browser crashes, and initial page load times, helping you understand how your app is performing on the frontend. You can look at aggregate performance across your whole application or drill down and understand performance on particular pages or flows.
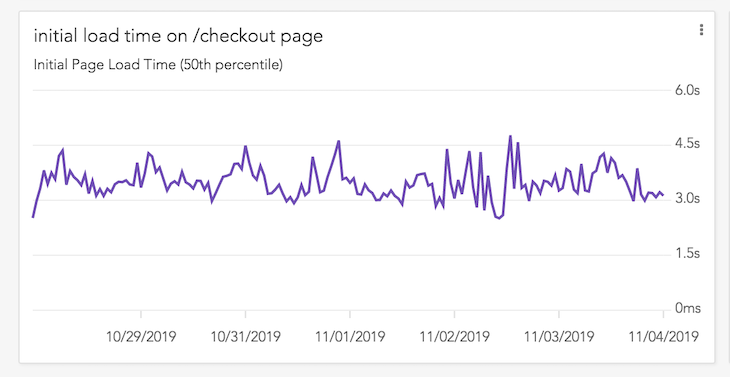
After defining a metric like “50th percentile of initial page loads on the /checkout page,” LogRocket adds a graph to your dashboard that shows you retroactive data over the past hour/day/week/month so you can immediately understand how your app has performed over time without waiting for data to collect.
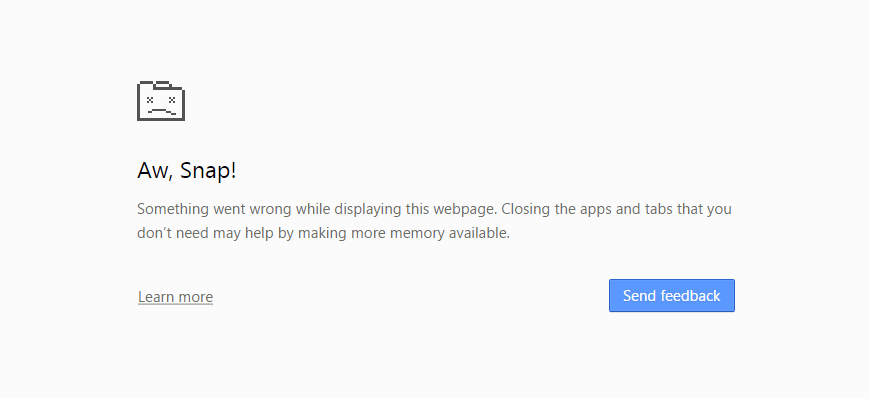
For example, one of our beta customers for Metrics is a bank, and recently started hearing complaints that the mortgage cost calculator on their website was crashing, showing the “Aw, Snap!” page in Chrome.
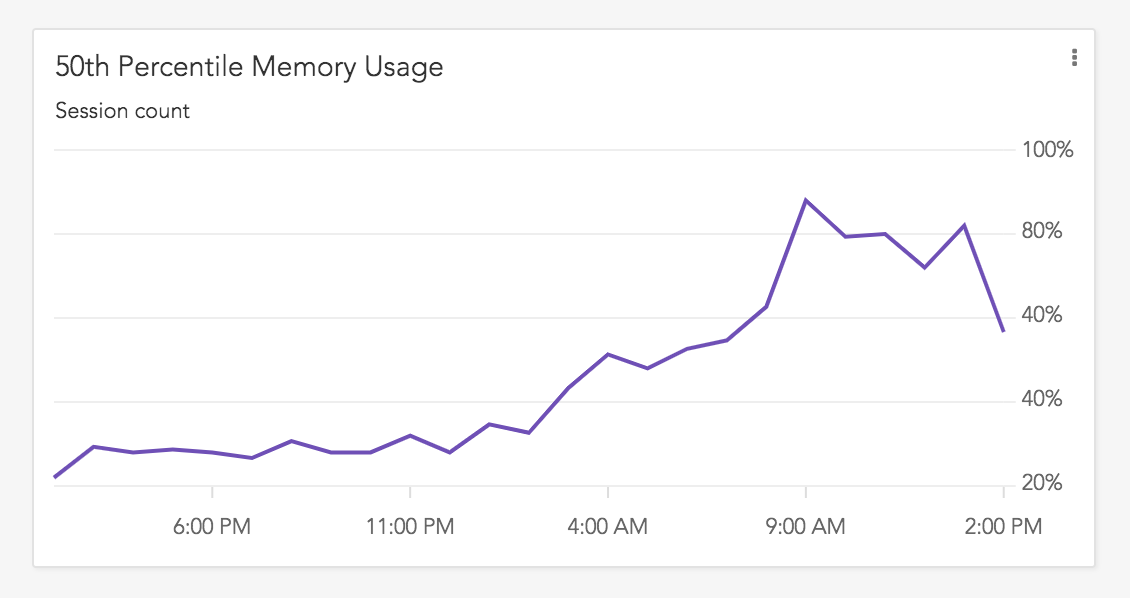
To help understand the problem, they added a Metric in LogRocket for browser crashes as well as memory and CPU usage.
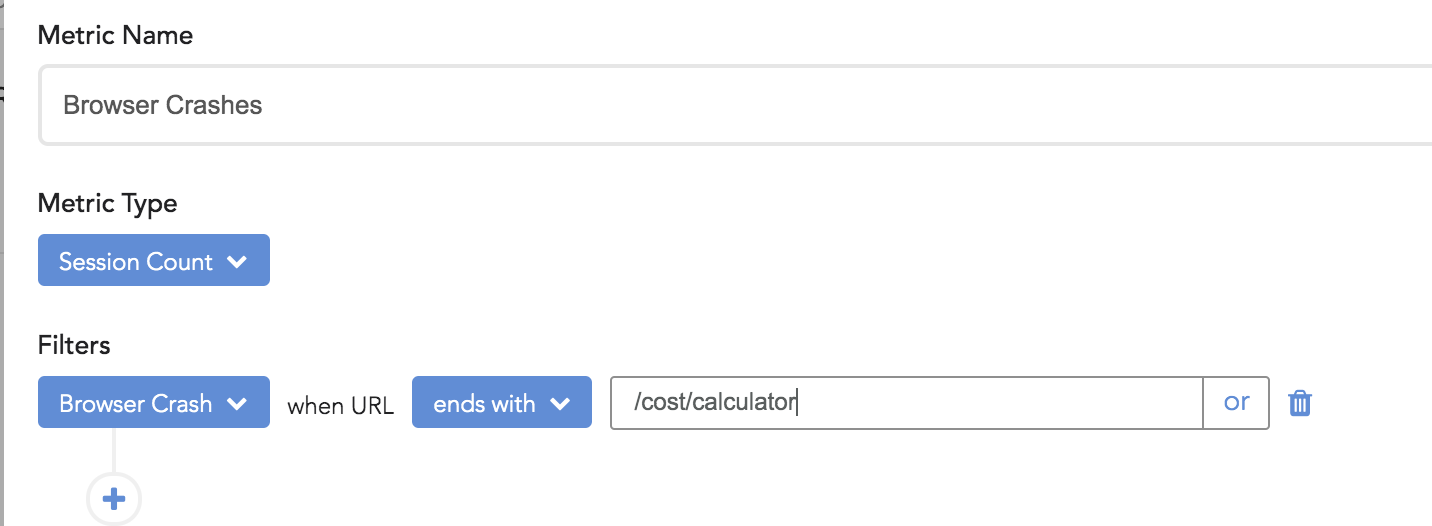
They were then able to see that browser crashes did indeed increase sharply when they launched their new page. Further, they saw how memory usage also increased markedly on that page in their app at the same time. After replaying some user sessions where the crash occurred, they were able to find the problem’s root cause and fix it.
In modern single-page apps, a single user flow such as “click checkout and then wait for the shopping cart modal to appear” can be the result of multiple network requests, resource loads, and frontend processing. With traditional APM tools, it’s difficult to measure such performance without writing code to define a transaction, and after the transaction is defined, you still have to wait days or weeks to gather enough data to have statistical significance.
LogRocket makes it quick and easy to gauge performance of such flows using our “Time Between Events” metric, which can measure time between clicks on a certain button, page loads, network requests, or custom events.
LogRocket also lets you define an event as the appearance of a certain HTML element, like “Element Visible [with text] [contains] [“Shopping Cart”],” which lets you measure the time for a modal or React component to load.

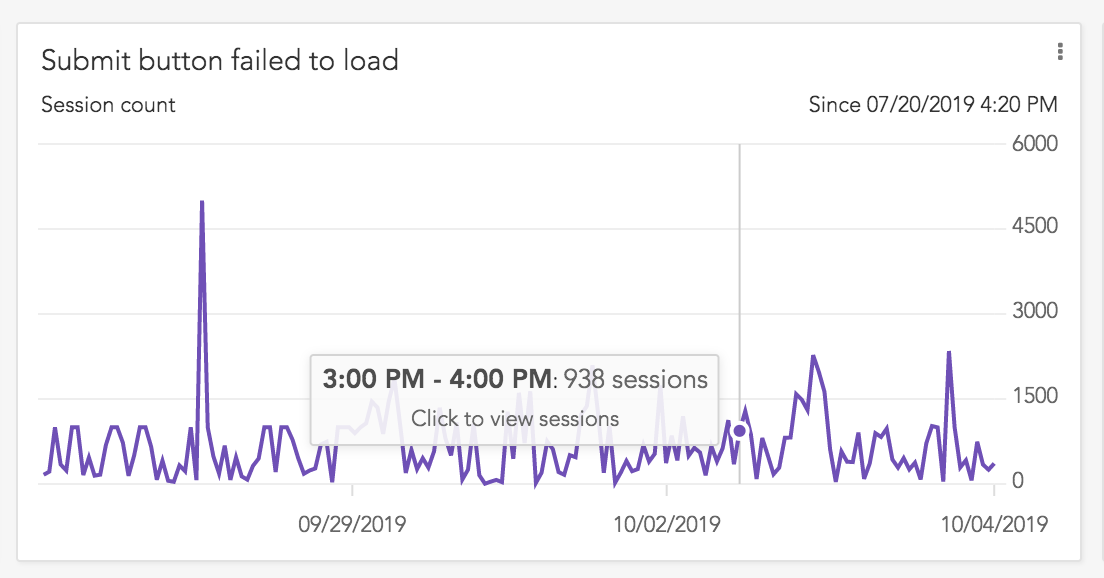
Graphs and charts are critical for getting a high-level view of how an application is performing, but often, it can be difficult to understand how performance numbers and network errors actually affect your user experience. How slow does a 350ms page load feel to the user? Did the retry logic correctly handle that 500 request?
To answer these questions, LogRocket lets you jump from any graph directly into actual user sessions. This lets you see the video of what users experienced so you can immediately understand and empathize with the quality of their user experience.
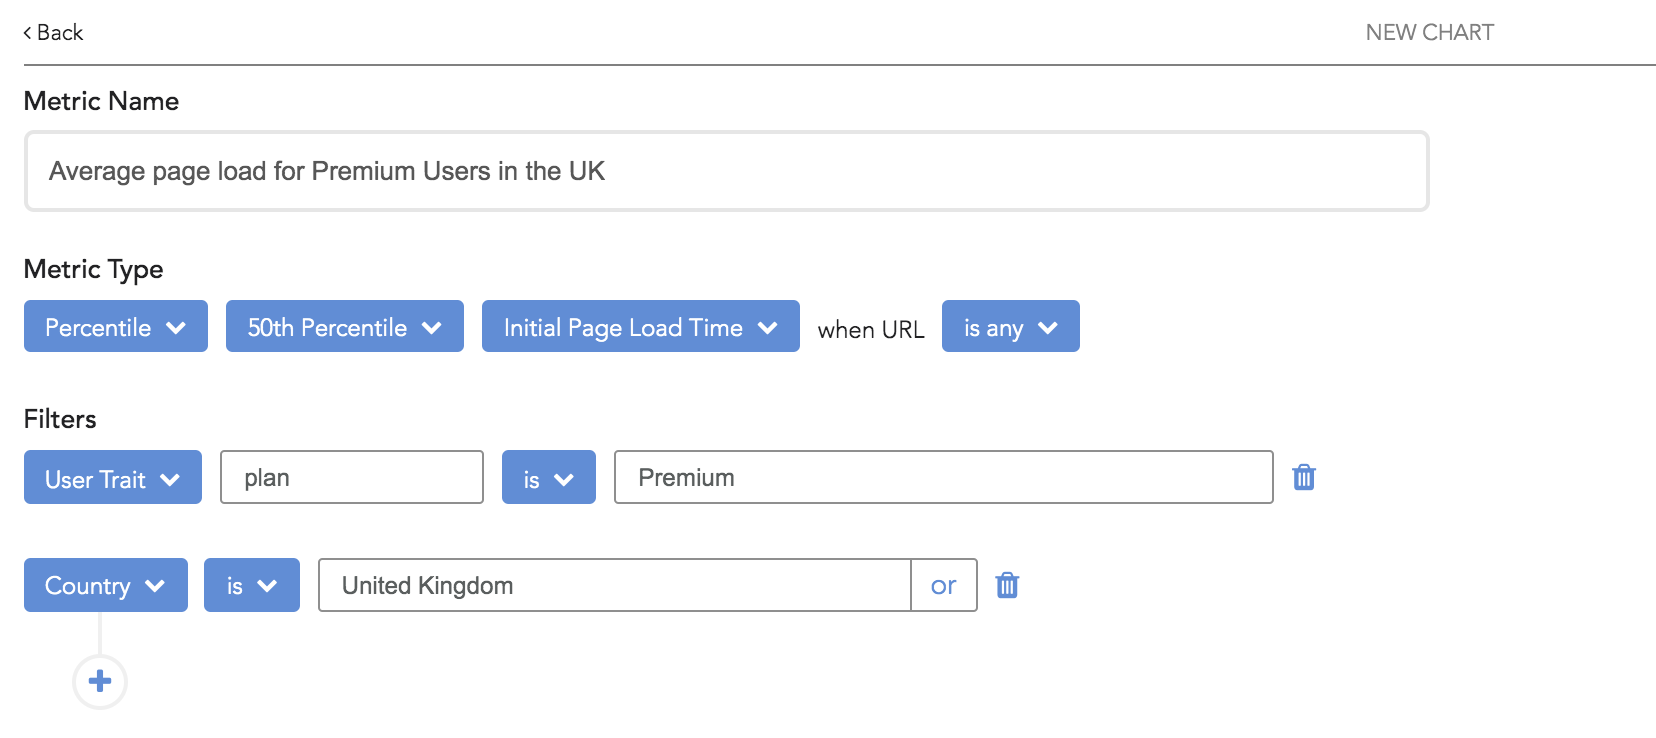
You can also combine performance metrics with filters for particular user behaviors or traits so you can understand how performance differs for certain cohorts of users like “Premium Users” in your application, users in a certain country, or people who have done any sequence of actions.
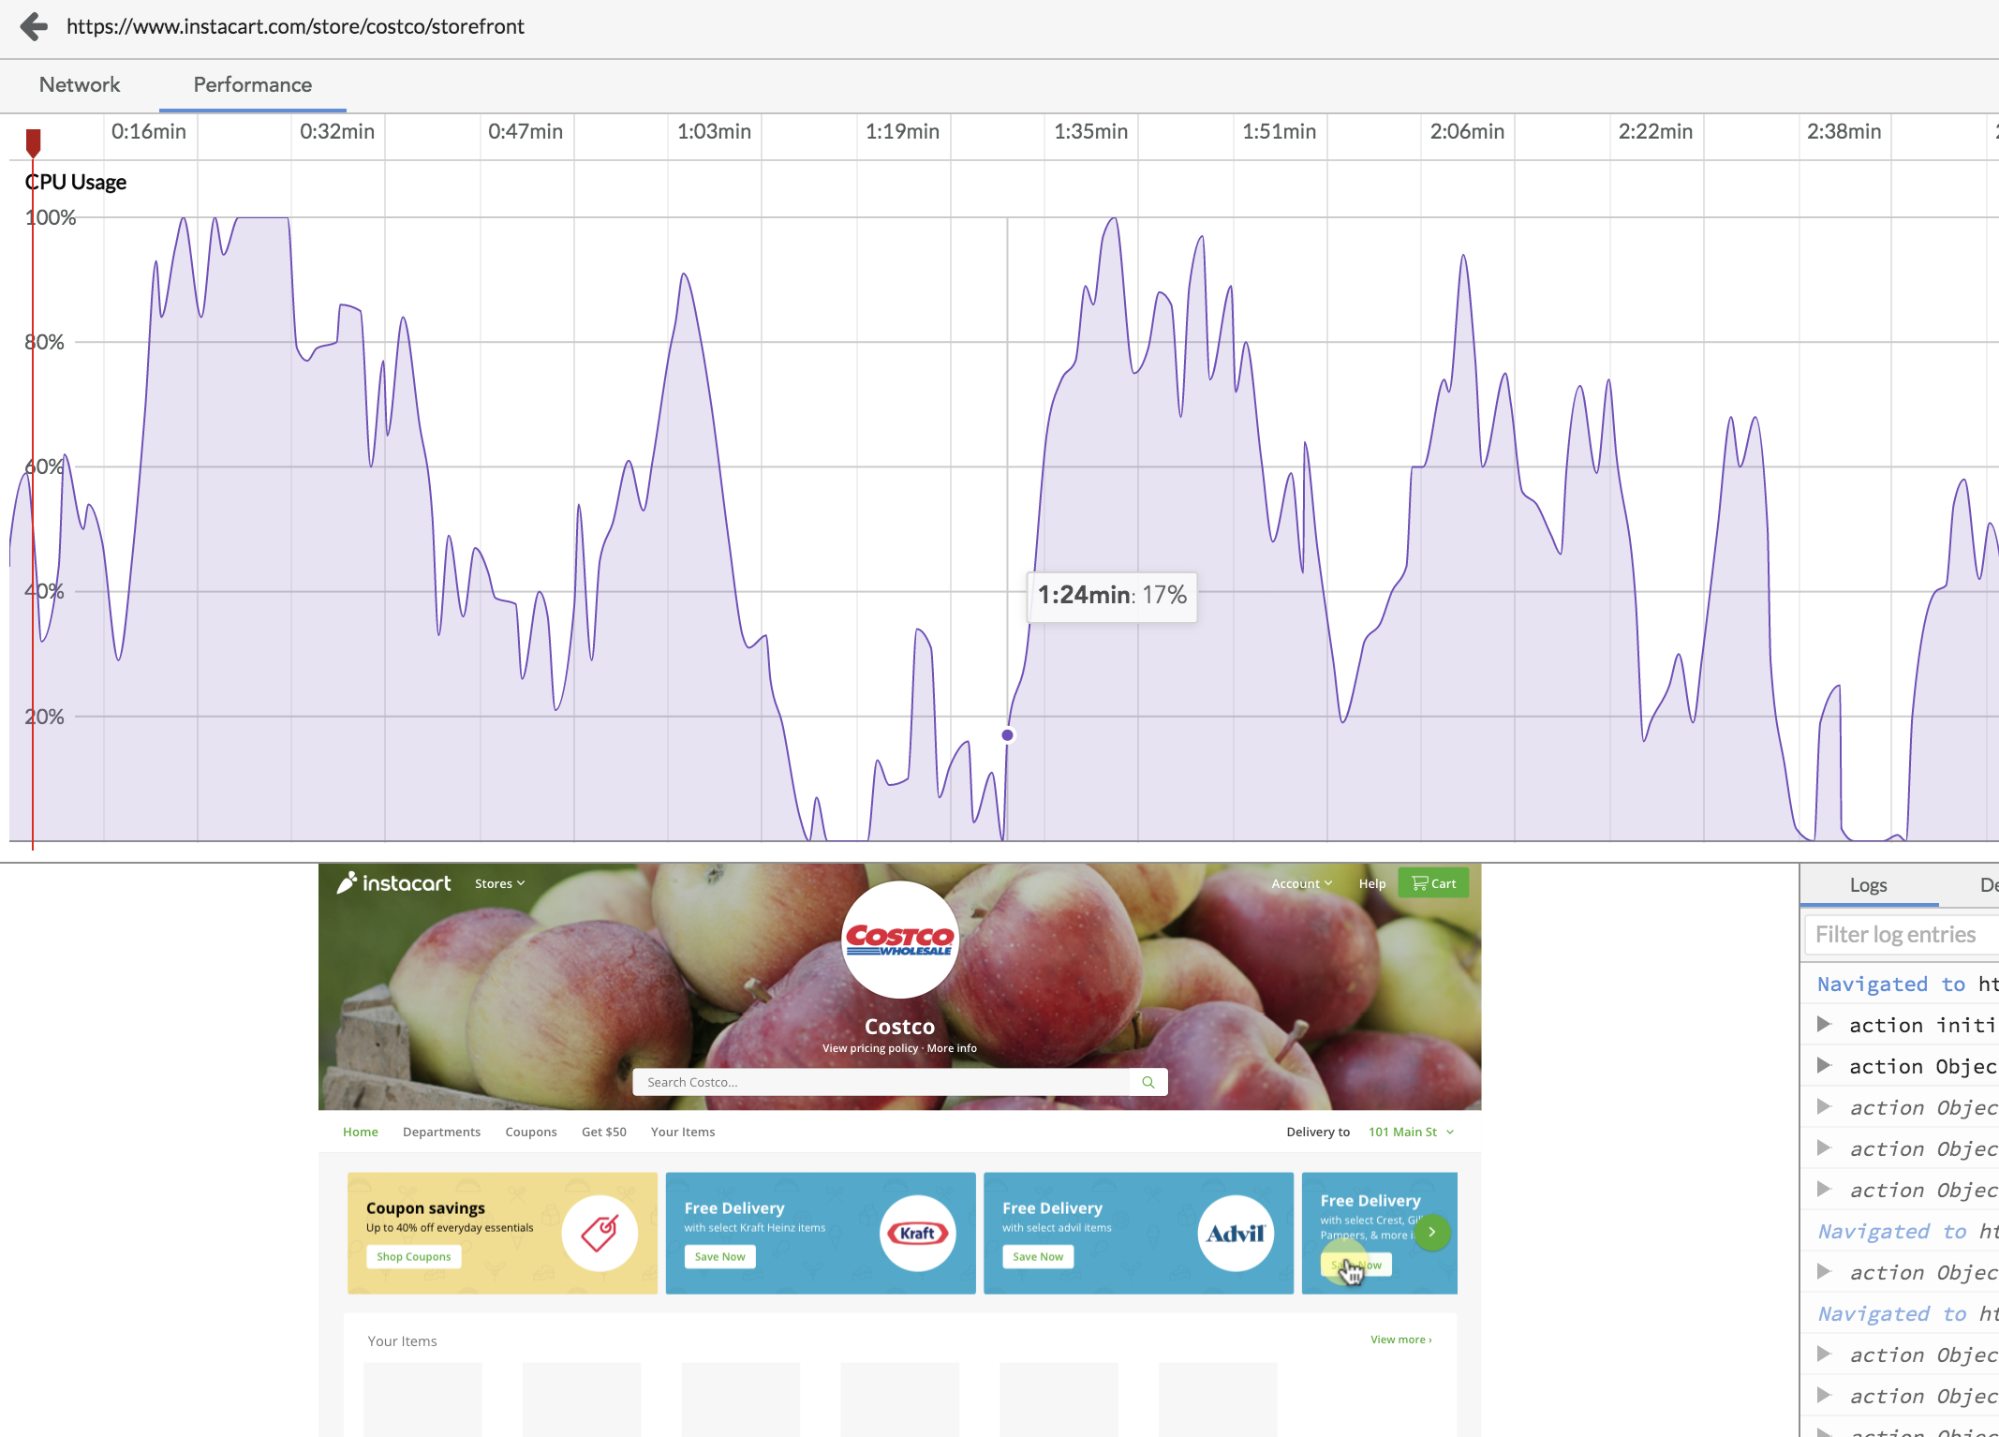
In the past, when a user or QA tester complained of poor performance or browser crashes, it would often be extremely difficult to understand what led to their bad experience.
Within a user’s session replay, LogRocket now lets you see CPU usage, memory usage, and network request timings alongside the session video to help you understand why your application was slow.
With any metric you create, LogRocket lets you set up alerting over Slack, email, or webhooks if a given threshold is crossed.

For example, you can be alerted if the 50th percentile timing for a key network requests goes over 500ms, or if the conversion rate on your shopping cart drops significantly in a new application release.
In addition to officially announcing LogRocket Metrics, today, we’re also excited to share that we’ve raised an additional $15 million in Series B funding led by our existing investors, Battery Ventures and Matrix Partners, to add to the $11 million Series A we closed earlier this year. We are honored to now have over 1,000 paying customers and are incredibly excited to continue our mission of helping teams build amazing applications.
The shift toward rich single-page apps has undoubtedly improved both user experience quality and developer productivity. But with greater complexity comes the need for more observability. Existing tooling is not yet sufficient for teams to have confidence in the frontend code they ship.
At LogRocket, we’ve taken what we believe is a big step toward a solution — but there’s lots more work to do. If you want to help define the next generation of tooling for frontend developers, we’d love to meet you. We’re hiring 🙂
Would you be interested in joining LogRocket's developer community?
Join LogRocket’s Content Advisory Board. You’ll help inform the type of content we create and get access to exclusive meetups, social accreditation, and swag.
Sign up now
Discover how to use Gemini CLI, Google’s new open-source AI agent that brings Gemini directly to your terminal.

This article explores several proven patterns for writing safer, cleaner, and more readable code in React and TypeScript.

A breakdown of the wrapper and container CSS classes, how they’re used in real-world code, and when it makes sense to use one over the other.

This guide walks you through creating a web UI for an AI agent that browses, clicks, and extracts info from websites powered by Stagehand and Gemini.