Android Studio comes with built-in support for Android Profiler, which provides a great way to debug your app and optimize its performance.
Android Profiler provides real-time data about your app, such as CPU, memory, network, and energy usage, as well as data on event profiling. It’s available on all Android Studio versions above 3.0.
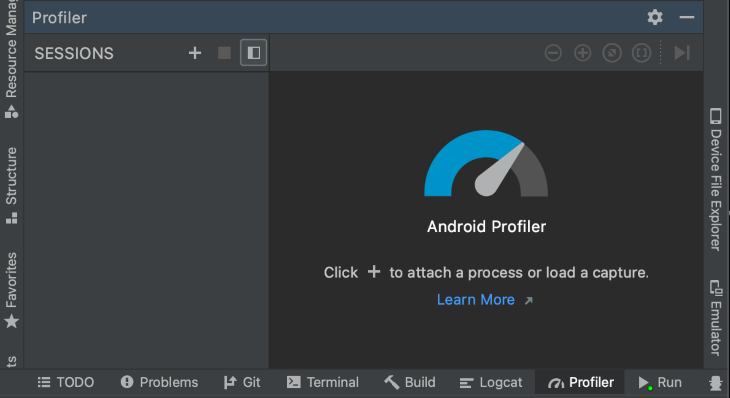
To start Android Profiler, go to View, Tool Windows, and select Profiler. This will open the Profiler window at the bottom of the screen.
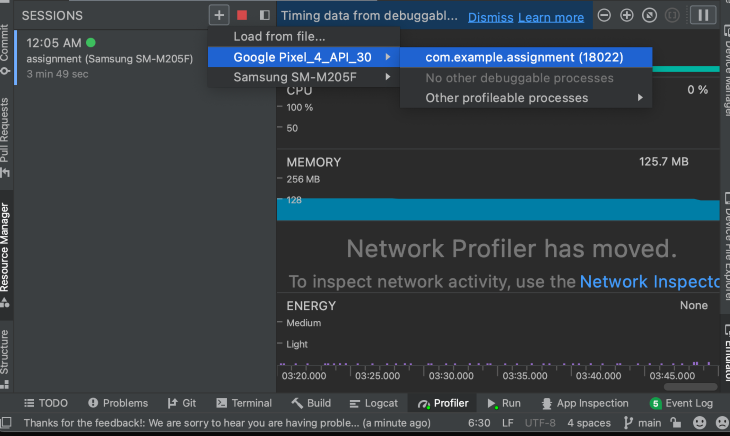
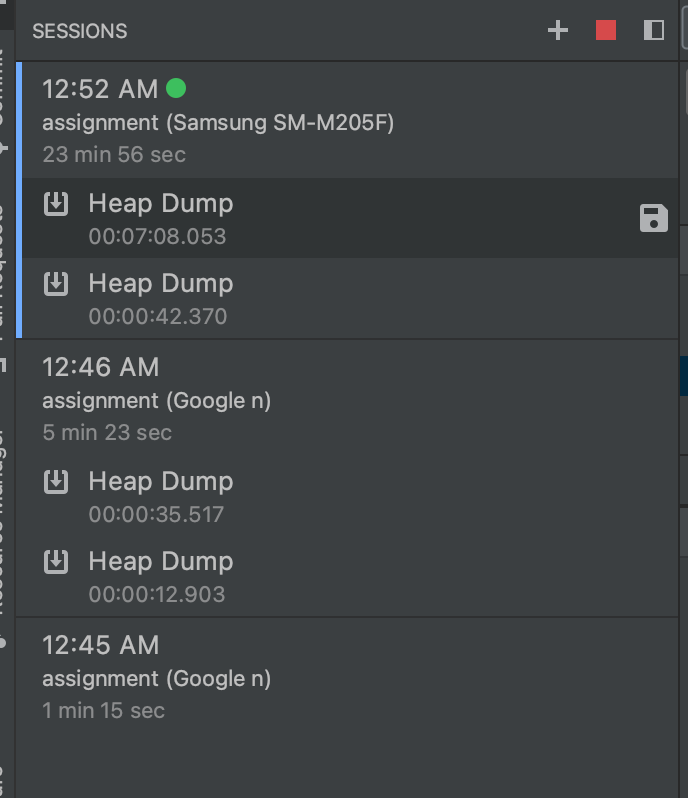
Now, run the app from the Android Studio on your phone or emulator. The Android Profiler will automatically pick up the process and add a new session, as seen in the picture below.
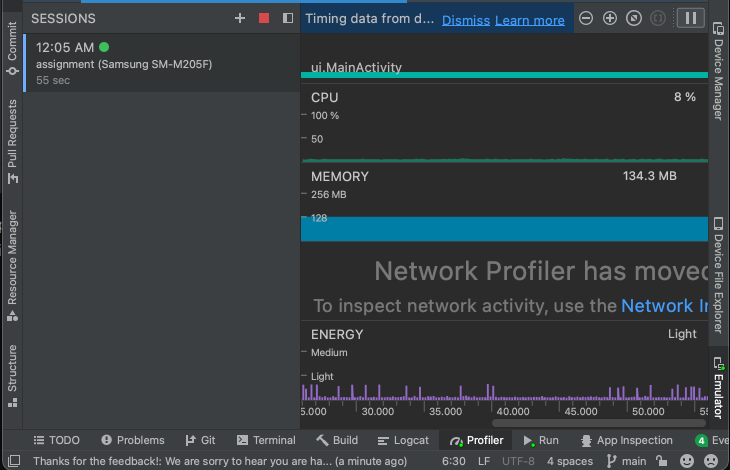
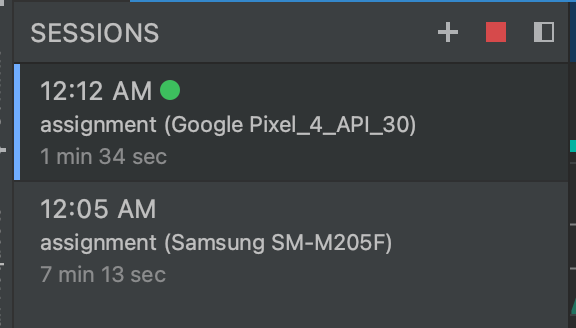
You can have one active session at a time. In the Sessions tab, you can see your last sessions, app names, device name, and the time lapsed. To add a new session, click the + button on the sessions toolbar, select your phone or emulator, then select the process you want to profile.
The blue line indicator shows the selected session, and the green dot shows the active session.
To open any Profiler, click anywhere on its respective row, where you’ll see a more detailed view.
Note: For Android Studio versions 2020.3.1+, Network Profiler has been moved to App Inspector. To open the Network Profiler, go to View > Tool Windows > App Inspection and select Network Inspector from the tabs.
For this example, we will profile the network usage of a simple Android application that fetches the number of likes and comments on a news article when it is clicked.
To open the Network Profiler, simply click anywhere in the Network Profiler row. Network Profiler will show you all the network requests and responses and plot them on a graph in real-time. Using this Profiler, you can ensure your app doesn’t perform any unwanted network activity, and you can debug all the network requests sent and received by your application.
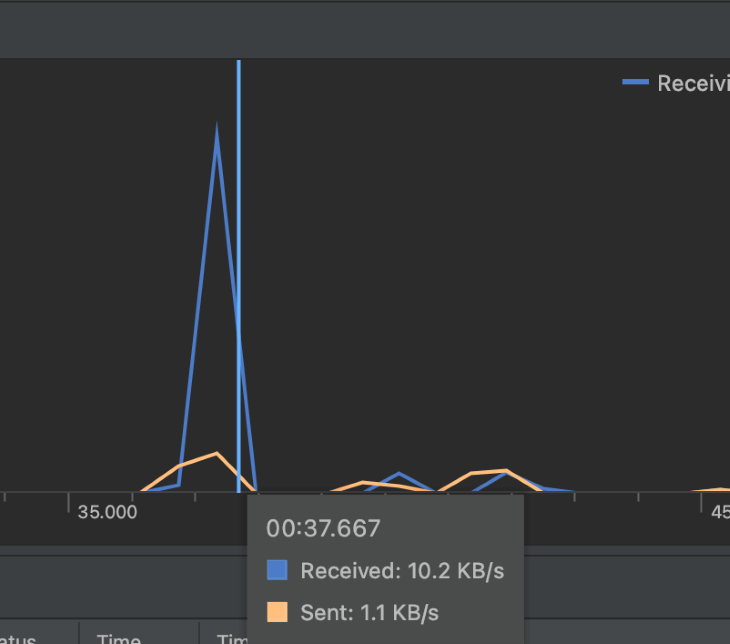
You can hover on the graph to find out the size of data sent and received in a particular instant, helping you evaluate if correct network requests and responses are being performed at the correct time.
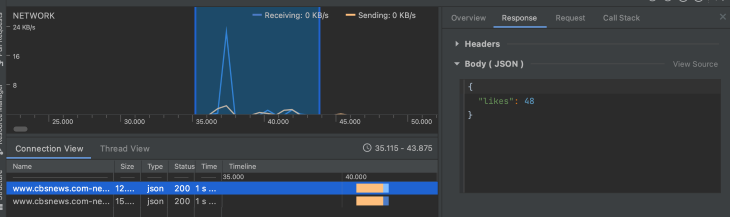
By default, Network Profiler shows data in real-time. However, you can also select a specified range of time. To select the time frame, click on a starting and ending point in the timeline.
As you select the range, all the network requests and responses in the selected timeframe will show up under the Connection View tab.
Connection View offers a detailed insight into the selected network requests and responses. To learn more about a specific request, click on the request and a more detailed view will be displayed.
You can find out the specifics of the request and responses such as headers, body, and thread information.
You can use the Energy Profiler to determine if your application drains more battery than it should, which can occur due to:
Energy Profiler can help you deduce, graphically, if your application is consuming too many resources, even when it doesn’t need to. You can use this profile to ensure that your app doesn’t drain a user’s battery.
Note that Energy Profiler doesn’t directly measure battery drainage. It only estimates power consumption by the resources the app consumes, which is why you can run Energy Profiler on an emulator, too.
Currently, our news app fetches news from the web every second instead of only once, which can be seen in the HomeViewModel file:
fun getArticles() {
    viewModelScope.launch {
        while (true) {
            delay(1000)
            getNewsFromWeb()
        }
    }
}
This can also be observed in the Energy Profiler.
As you can see above, our app spends constant energy on CPU and network resources. After removing the erroneous code and making it fetch news only once, you can observe the changes in the Energy Profiler again.
You can see that after initially loading the news articles from the web, our app barely uses any resources.
Memory Profiler helps you debug crashes, applications not responding (ANRs), and freezes due to memory leaks in your application. Ideally, Android System takes care of garbage collection automatically by removing the objects created that are not in use.
However, sometimes due to memory leaks, memory taken up by these objects cannot be released back to the heap, which leads to garbage collection events and thereby slowing down or even killing the application.
Memory Profiler helps you identify if and when your application doesn’t release unused objects. You can also force Android to garbage collect using this Profiler. Memory Profiler splits memory into various components, such as Java, native, graphics, etc., and the number of objects allocated.
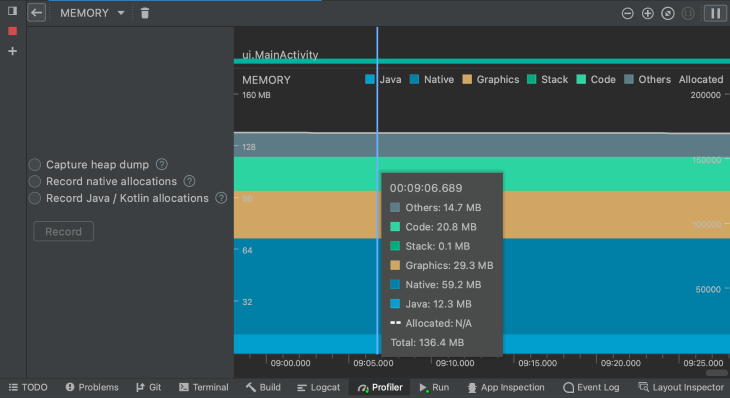
To see the objects allocated, you can capture a heap dump. This will record all the objects allocated by Android OS and by our application.
You can also capture native allocations, including memory from objects from C/C++ code or Java/Kotlin allocation, which will capture objects from Kotlin/Java code.
For Android v7+, you can check the allocated objects in real-time without having to capture a heap dump. After capturing the heap dump, you can see the allocated objects. You can filter these objects by class, by package, or by call stack.
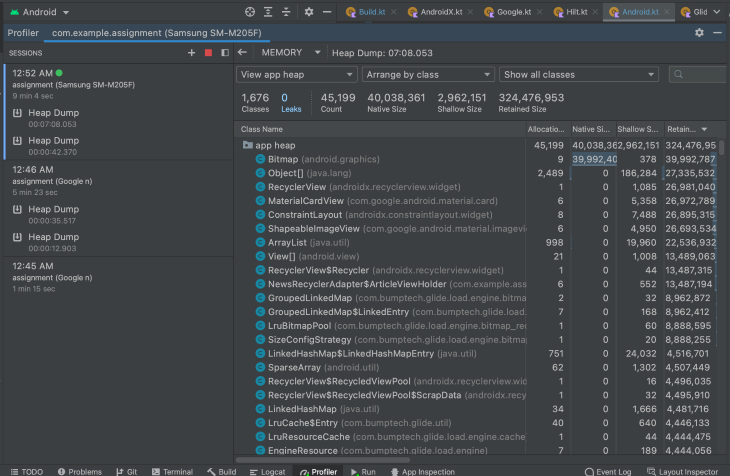
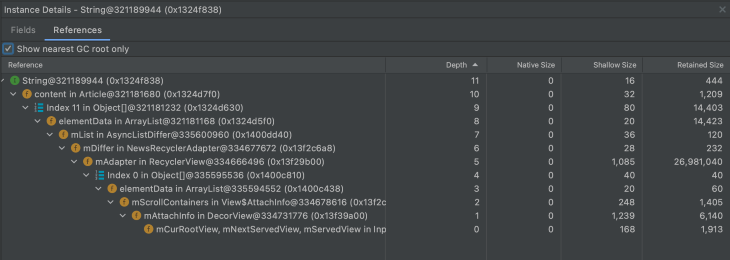
For this example, we will profile the string objects allocated by our application. You can look for the object type and click it.
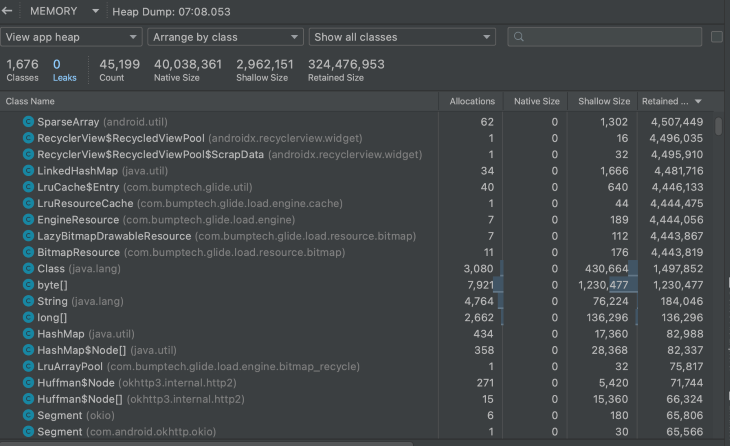
Clicking it reveals all the string objects allocated by our application.
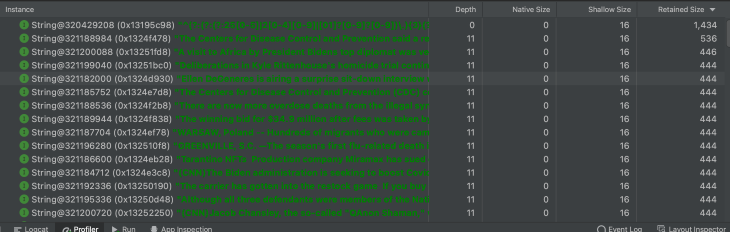
Details about each object can be found in Instance Details, which is revealed after clicking a specific object.
You can also record multiple heap dumps and compare them if certain objects are successfully deallocated.
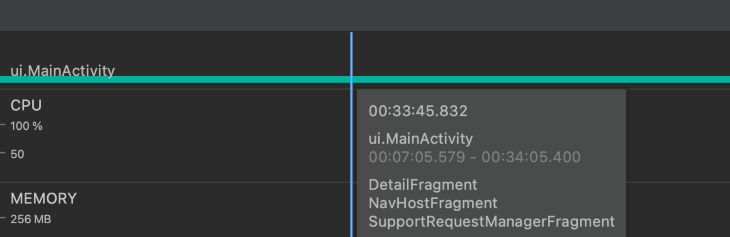
You can monitor events like touch, activity transitions, and device rotations. Touches are registered as red dots right above the name of the displayed activity. The events are displayed in all the children.
To learn more about the displayed activity and fragment, hover over the blue line. A pop-up containing all the view details will appear:
One of the best ways to troubleshoot your application’s performance is to analyze its CPU usage. By using CPU Profiler, you can monitor your app’s CPU usage and thread activity in real-time while running your app on a real device or an emulator.
You can see the list of all the threads in your application. Thread states are indicated in the CPU profiler by three colors. Green indicates that the thread is running, yellow indicates that the thread is active but waiting for another I/O operation to finish, and gray indicates that the thread is inactive. To get an even more detailed view of all the methods executed, you need to press the record button.
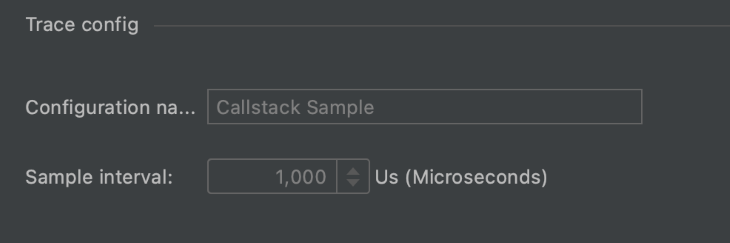
While recording, you can edit the sampling rate by clicking the Edit Configurations button. The sampling rate is the number of times the CPU is sampled. The CPU Profiler might not be able to detect short-lived methods. To capture those short-lived methods, you can further decrease the sampling interval.
You can record the stack trace of your app over the interval where your app feels janky. Press the record button and move through your app’s UI on the phone where it feels slow.
After recording, a system trace is generated, similar to the screenshot below.
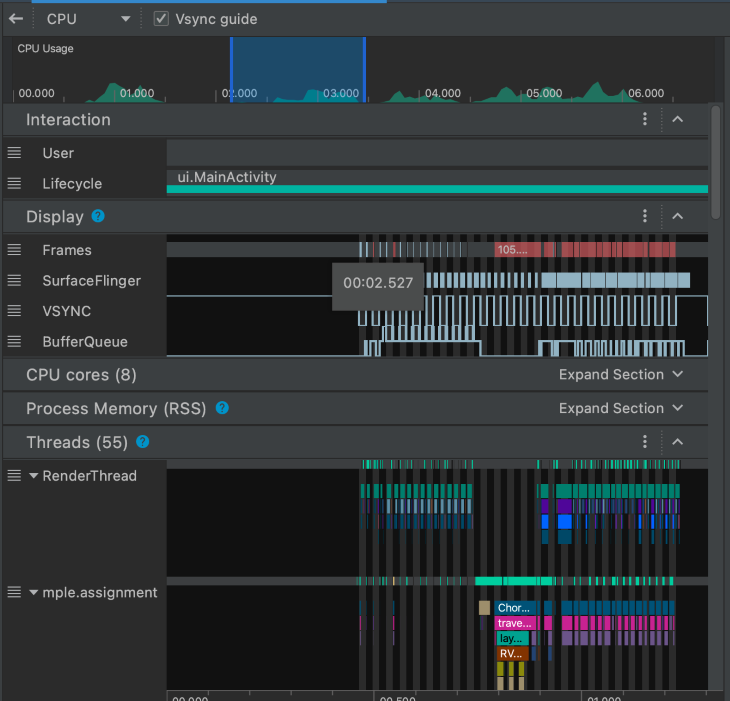
You can use the time range selector on the top left to focus on your desired time interval. The data below will reflect the interval selected.
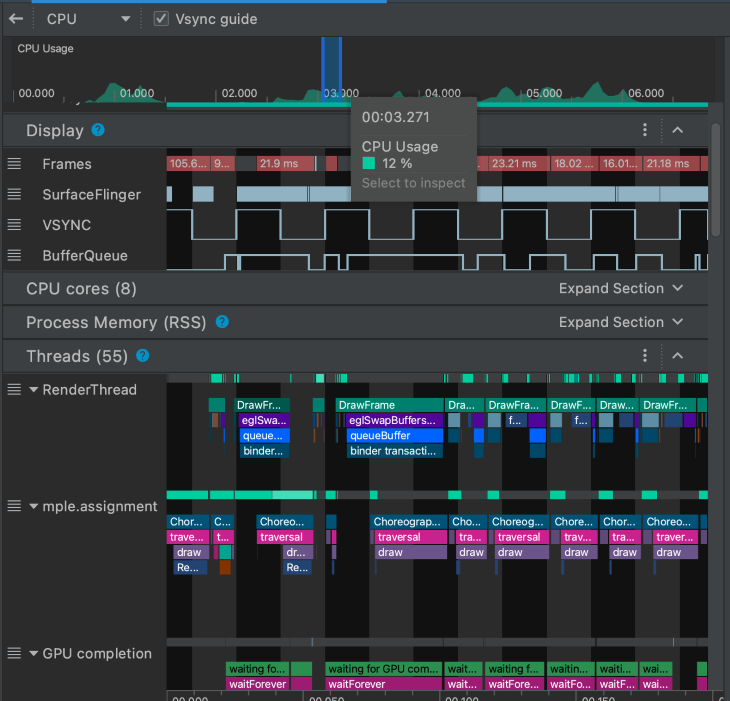
You can also inspect UI performance in the display section, such as when a frame is drawn, how many frame buffers are queued up, etc. You can read more about Android graphic performance here.
In the Threads section, you can see all the thread activities and easily find the active ones. The thread events are shown in a graph and are arranged in the order of decreasing events inside each thread.
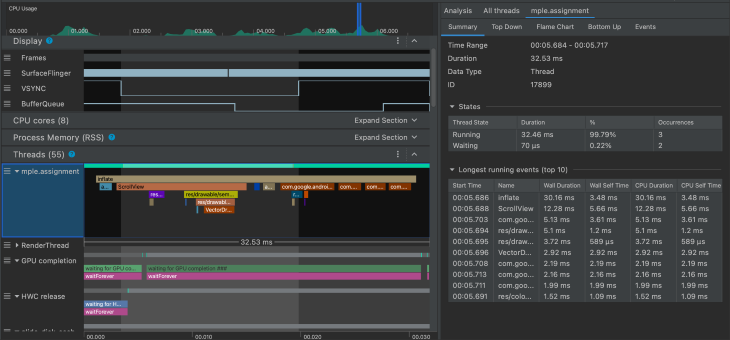
To dive into more details within a thread, you can select the area of interest and press the M key. This will focus on the selected area within a thread.
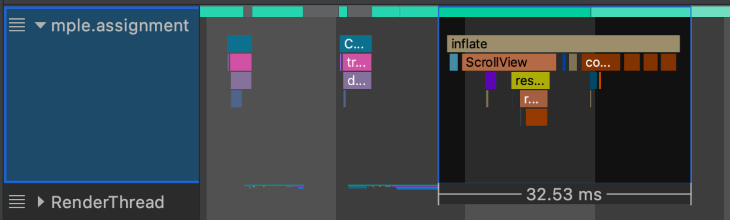
The selected area above will now be in focus. The summary of this thread activity can be seen in the pop-up on the right.
You can also hover over a trace event to find its time duration. Longer events may lead to frames skipping, lagging, or even crashing.
Android Profiler makes it easy to find bugs or troubleshoot your Android application. Without requiring any third-party library, Android Studio allows you to profile your application’s CPU, network, energy, and memory usage. It also enables you to build an app that is free from slow performance, high battery consumption, and memory leakages.
Install LogRocket via npm or script tag. LogRocket.init() must be called client-side, not
server-side
$ npm i --save logrocket

// Code:

import LogRocket from 'logrocket';
LogRocket.init('app/id');
// Add to your HTML:

<script src="https://cdn.lr-ingest.com/LogRocket.min.js"></script>
<script>window.LogRocket && window.LogRocket.init('app/id');</script>
Would you be interested in joining LogRocket's developer community?
Join LogRocket’s Content Advisory Board. You’ll help inform the type of content we create and get access to exclusive meetups, social accreditation, and swag.
Sign up now
Discover how to use Gemini CLI, Google’s new open-source AI agent that brings Gemini directly to your terminal.
This article explores several proven patterns for writing safer, cleaner, and more readable code in React and TypeScript.
A breakdown of the wrapper and container CSS classes, how they’re used in real-world code, and when it makes sense to use one over the other.

This guide walks you through creating a web UI for an AI agent that browses, clicks, and extracts info from websites powered by Stagehand and Gemini.