If you’re using Sentry, then you already know it’s one of the best tools for tracking errors in JavaScript apps. By adding just a few lines of code, Sentry will alert you whenever important errors happen in your app and help you understand how often they are occurring in production.

But error reporting alone has a few limitations. It is often difficult to understand an error’s impact since many have no actual effect on users. And for hard-to-fix exceptions, error reports lack enough context to figure out the root cause.
That’s where LogRocket comes in. LogRocket is the first logging tool built for frontend JavaScript apps. After adding a few lines of code, LogRocket captures console logs, network requests, Redux actions/state, and more, giving complete context on every bug.
In addition, LogRocket records the HTML/CSS in your app, letting you replay a pixel-perfect video to see if an exception actually impacted user experience.
The Replay is a weekly newsletter for dev and engineering leaders.
Delivered once a week, it's your curated guide to the most important conversations around frontend dev, emerging AI tools, and the state of modern software.
Integrating Sentry and LogRocket lets you see a LogRocket “session” for every error in Sentry. Here’s how it works:
Sentry.configureScope(scope => {
  scope.setExtra("sessionURL", LogRocket.sessionURL);
});
LogRocket.sessionURL returns null in cases where the LogRocket SDK hasn’t fully initialized and begun sending session data back to LogRocket servers. To guarantee the presence of a session URL, pass a callback to LogRocket.getSessionURL():
LogRocket.getSessionURL(sessionURL => {
  Sentry.configureScope(scope => {
    scope.setExtra("sessionURL", sessionURL);
  });
});
That’s it! The next time you have an error in your app that triggers Sentry, you will see this extra field in the bottom of the Sentry report.

Clicking on the sessionURL link will take you to the LogRocket session in which that error occurred. Here is what a LogRocket session looks like:
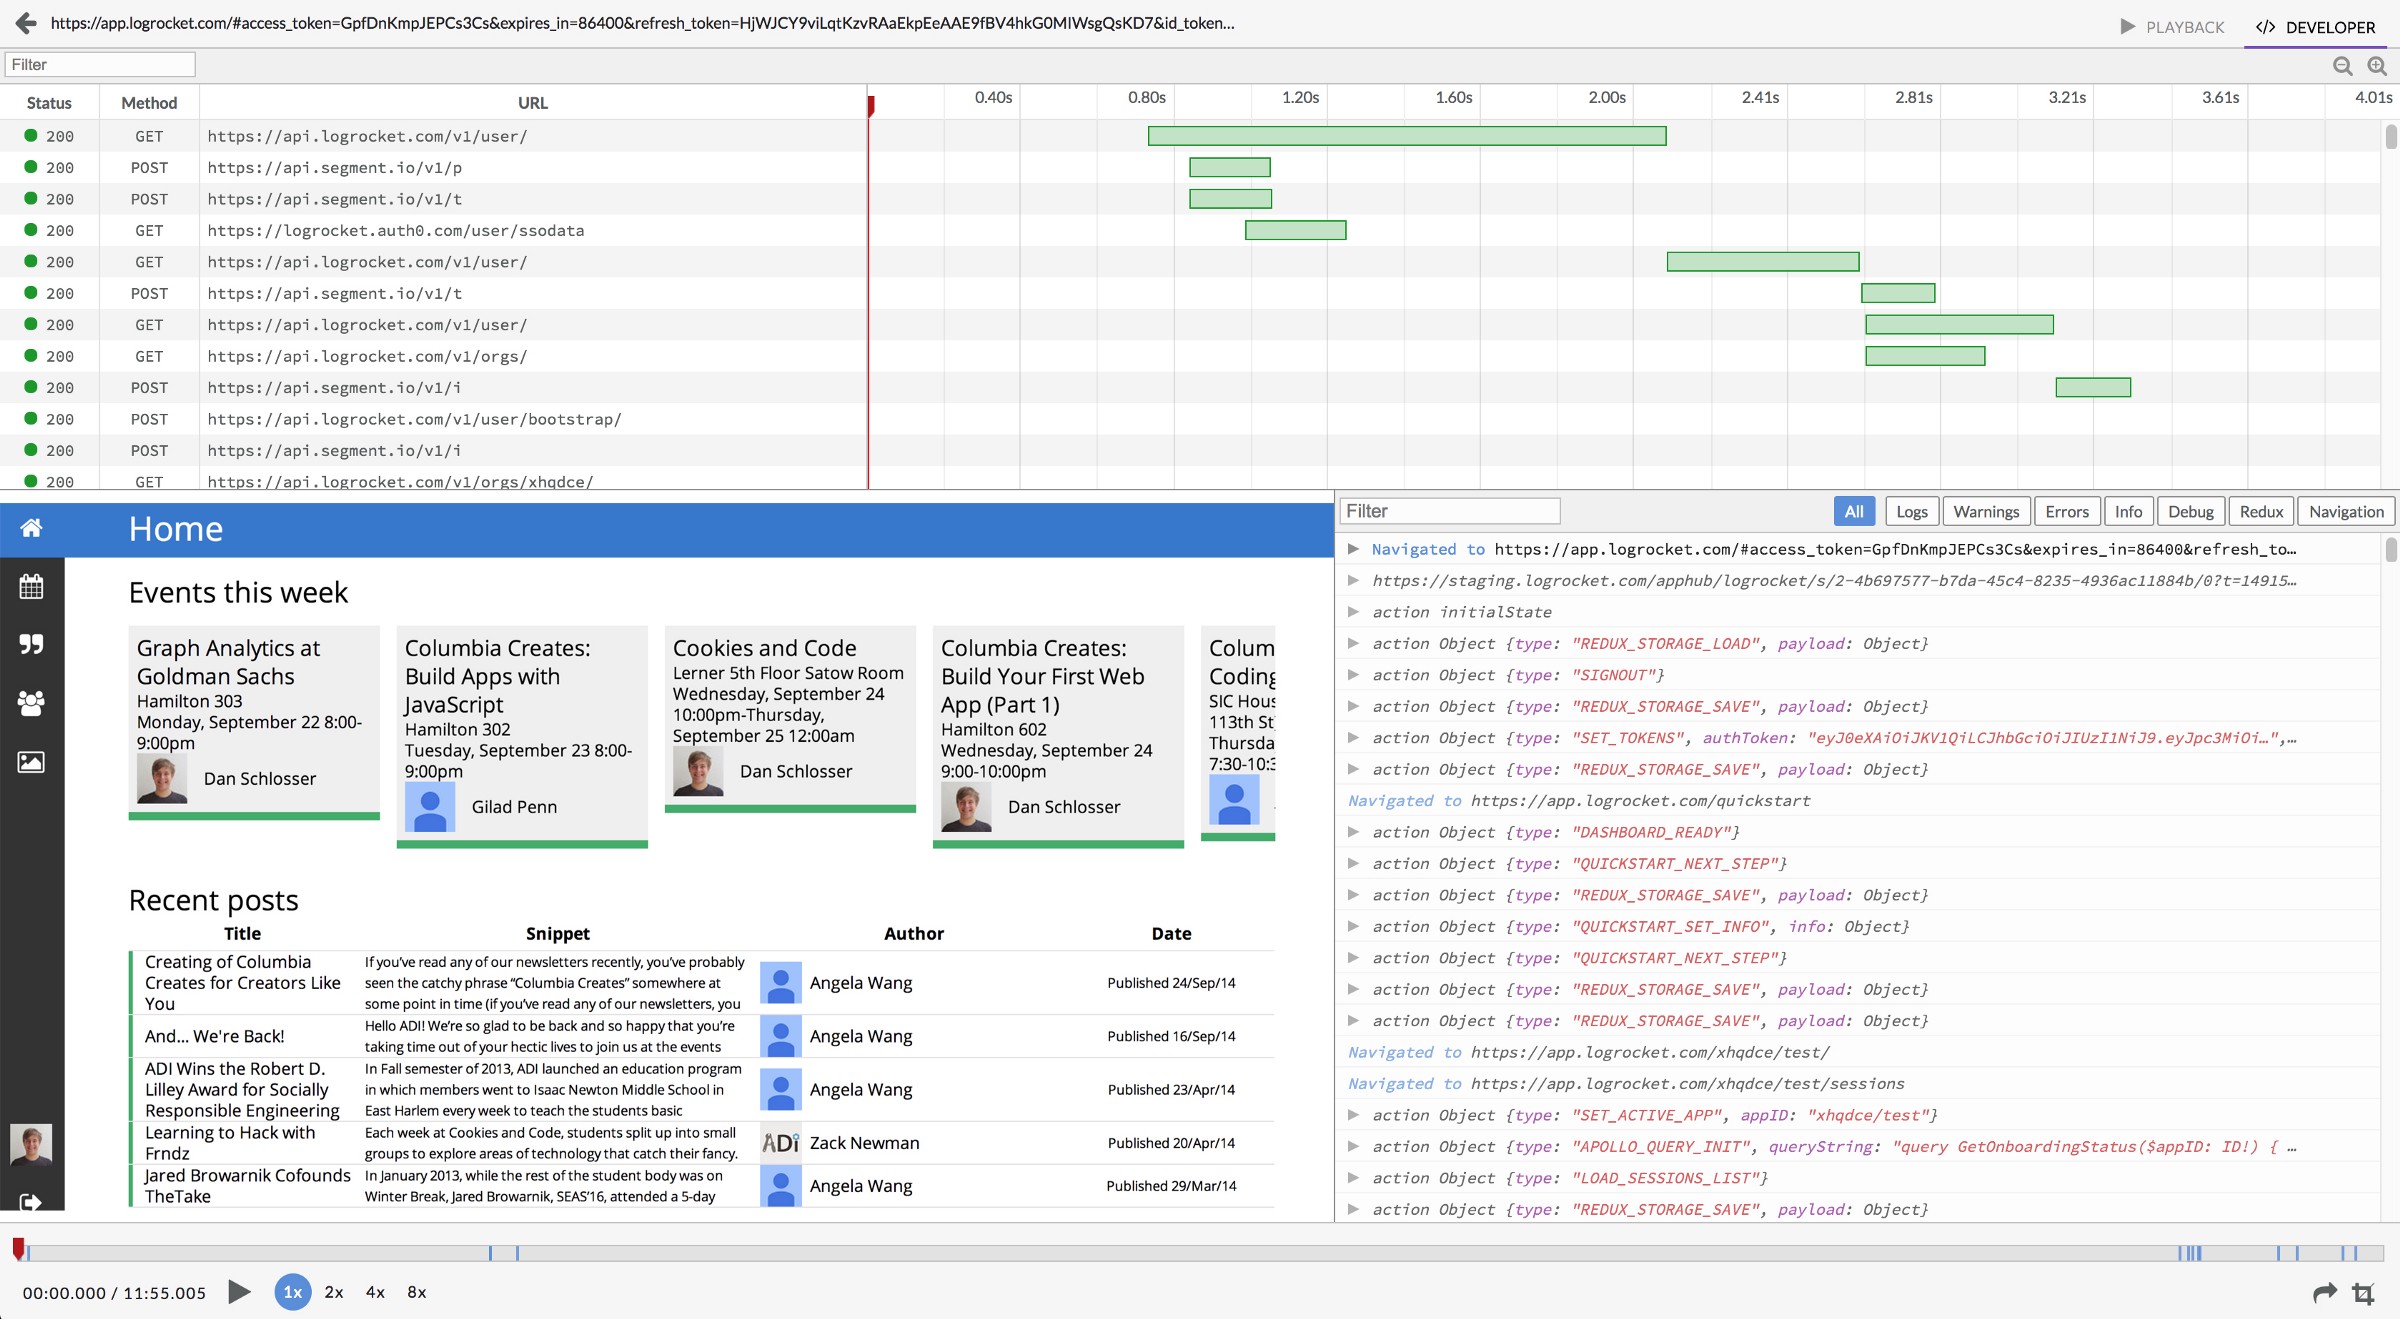
On top, we see network requests, with the waterfall chart showing their relative timings. Clicking on a request shows the associated headers and body, as well as the response from the server.
In the lower left we see the pixel-perfect session video. This “video” is actually a reconstruction of the DOM, so you can inspect the HTML/CSS to understand visual bugs or play it back at 2x speed to get a quick overview of what a user did to trigger a bug.
Finally, in the lower right we see the console viewer. This shows all the console logs, warnings, and errors in the app. If you’re using Redux, this also shows actions and lets you inspect state at any point in time.
Integrating LogRocket into your Sentry workflow helps give you extra context to solve bugs quickly and easily. To get started, visit https://logrocket.com.
Read the case study to see how Branch’s team can quickly optimize the Branch platform to meet the needs of its new and existing customers.
“Thanks to the integration between LogRocket and Sentry, debugging is faster and easier than it was with our previous solution.” – Joe Emison, CTO

Build dynamic LLM routing in Next.js with OpenRouter, TanStack AI, task classification, model fallbacks, and cost-aware routing.
TSRX adds first-class control flow, conditional hooks, and scoped styles to React via a TypeScript compiler extension — no new framework required.
Learn how to build a full React Native auth system using Better Auth and Expo — with email/password login, Google OAuth, session persistence, and protected routes.

Compare the top AI development tools and models of June 2026. View updated rankings, feature breakdowns, and find the best fit for you.
Hey there, want to help make our blog better?
Join LogRocket’s Content Advisory Board. You’ll help inform the type of content we create and get access to exclusive meetups, social accreditation, and swag.
Sign up now
