Debugging is used to detect and fix faults in programs, preventing them from performing incorrectly after being deployed to production. When there are several tightly-connected modules, debugging becomes even more complicated since each change made in one module may cause errors in another.

Developers can debug Go applications with the Visual Studio Code editor. With the required debugging extensions, the VS Code editor provides outstanding tools for debugging Go programs. In this article, we’ll learn how to debug Go applications using the VS Code editor:
To complete this tutorial, you’ll need the following:
For a better grasp of how the VS Code debugger works, let’s create a basic Go application that generates a JSON output from an array. To create the new Go program, open your terminal and run the commands below:
mkdir go-debugging
cd go-debugging
go mod init github.com/USERNAME/go-debugging
touch cmd/go-debugging/main.go
In the command above, change USERNAME to your personal GitHub username. Open the main.go file and add the following code using your VS Code editor:
package main

import (
   "encoding/json"
   "fmt"
   "log"
)


type user struct {
   FullName string `json:"full_name"`
   Email string `json:"email"`
   Gender   string `json:"gender"`
   Status   string `json:"status"`
   RegDate   string `json:"Reg_date"`
}


func main() {
   userinfos := []user{
       {
           FullName: "blessing james",
           Email: "[email protected]",
           Gender:   "Male",
           Status:   "active",
           RegDate:"20-01-2021",
       },
       {
           FullName: "matt john",
           Email: "[email protected]",
           Gender:   "Male",
           Status:   "active",
           RegDate:"20-01-2021",
       },
       {
           FullName: "john peace",
           Email: "[email protected]",
           Gender:   "Midgard",
           Status:   "active",
           RegDate:"20-01-2021",
       },
   }


   jsonBytes, err := json.Marshal(userinfos)
   if err != nil {
       log.Fatalln(err)
   }
   fmt.Println(string(jsonBytes))
}
The code above will print the array userinfos in JSON format. You can execute the application using the command below:
go run main.go
The output of the command above is in JSON format, as shown below:
[{"full_name":"blessing james","email":"[email protected]","gender":"Male","status":"active","Reg_date":"20-01-2021"},{"full_name":"matt john","email":"[email protected]","gender":"Male","status":"active","Reg_date":"20-01-2021"},{"full_name":"john peace","email":"[email protected]","gender":"Midgard","status":"active","Reg_date":"20-01-2021"}]
Setting up the debugging configuration in Go is pretty simple and straightforward. From your VS Code’s sidebar menu, click on the Run and Debug button, then click on create a launch.json file:
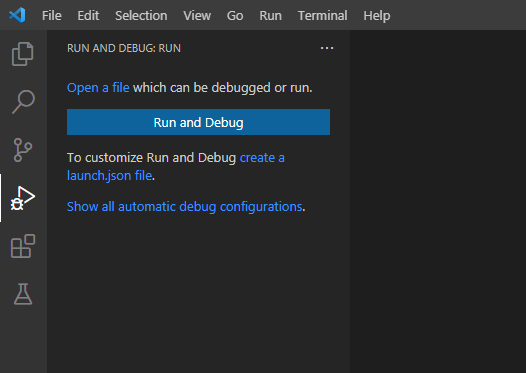
You’ll see a dropdown menu where you can select your workspace folder. Then, select Go for environment language. Finally, select Launch Package for debug configuration. This configuration will create the launch.json file, which will contain the following code:
{
    // Use IntelliSense to learn about possible attributes.
    // Hover to view descriptions of existing attributes.
    // For more information, visit: https://go.microsoft.com/fwlink/?linkid=830387
    "version": "0.2.0",
    "configurations": [
        {
            "name": "Launch Package",
            "type": "go",
            "request": "launch",
            "mode": "auto",
            "program": "${fileDirname}"
        }
    ]
}
Change the value for program in the JSON settings above to the application file name, main.go in our case:
"program": "main.go"
After you save the launch.json configuration, the DEBUG CONSOLE at the bottom of the editor window will display your project’s output. The debug toolbar will appear at the top of the screen, allowing you to step through the code, pause the script, or end the session.
To debug the application, click on the play icon near RUN AND DEBUG, which will display the program output in the DEBUG CONSOLE window:

If you are run delve debugger extension for the first time, you will likely get an error, as shown below:
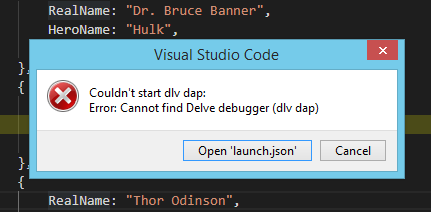
To resolve this error, in your terminal enter the command below and click on run and debug icon again:
Install -v githup.com/go-delve/cmd/dlv@latest
A breakpoint allows you to inspect a line of code by pausing its execution. Breakpoints can be set practically anywhere in VS Code, including variable declarations, expressions, comments, and blank lines, with the exception of function declaration statements.
Let’s add breakpoints to lines 26, 29, and 35. Simply click to the left of the line number, and you’ll see a red dot appear:
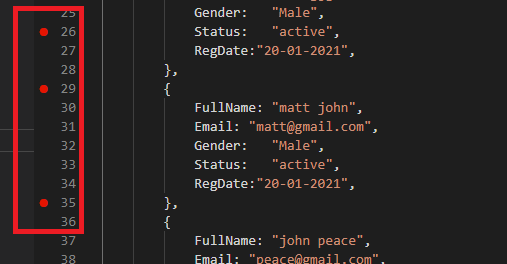
When you debug the program above, execution will pause at each breakpoint. First, the program will automatically pause on line 26. By clicking on the Continue button F8from the debug toolbar, the program will resume its execution until the next breakpoint is reached on line 29, then line 35.
Under the VARIABLES panel, we can inspect the current scope of each identifier by hovering over the line of the current breakpoint, marked in yellow.
In VS Code, you can modify breakpoints by giving them an expression, usually a boolean expression, allowing you to inspect your program whenever certain expressions are true or false.
For example, we could add a conditional breakpoint that is raised only when the expression is true, as in user[2].email == "[email protected]". To do so, right-click on the breakpoint and select Conditional Breakpoint:

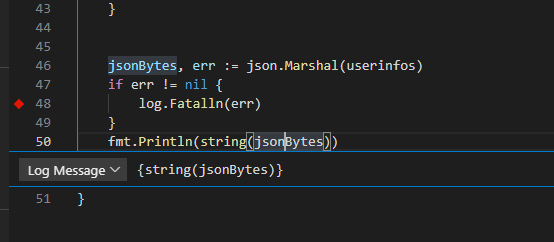
Instead of pausing the code execution and breaking into the debugger, the logpoint is a type of breakpoint that logs a message or value to the console, which is important for the debugging workflow.
To add and remove log() statements without changing the code, right-click the gutter and select Add Logpoint. In place of the red circle, the logpoint is represented by a red diamond-shaped icon. In the terminal, you’ll see a text input field; to log an expression or variable’s value, put it in curly brackets:
At the top of the VS Code editor, you’ll see the debug toolbar, which contains directions for effectively navigating the debugger. Let’s review these one by one:

F8You can use the continue F8 button to resume the program’s execution when it pauses at a breakpoint. When debugging your Go program in VS Code, you can add as many breakpoints as you want.
F10The step over command F10 runs the line of code that is currently highlighted before moving on to the next line. You can use the step over command to advance down a function, fully comprehending how it is executed.
If you use the step over command on a line that calls a function, it will execute the whole function, pausing at the first line underneath the function.
F11Like the step over command, we can use the step into command to debug a program line-by-line. However, if the step into command encounters a function, the debugger will enter the function that was called, continuing to debug line-by-line from there.
Shift+F11The step out command continues the current function’s execution, pausing at the last line. For example, if you mistakenly type a function that has nothing to do with the problem you’re trying to address, you can use the step out command to quickly exit the function and return to the relevant part of your codebase.
Ctrl+Shift+F5Whenever you wish to restart debugging a program that has hit a breakpoint, you can use the restart command to start debugging the program from the beginning instead of killing and relaunching the debugger.
Shift+F5Once you’ve finished debugging your program, use the stop command to exit the debugging session. When you connect to an external Node.js process, a disconnect icon will appear.
VARIABLES panelNow that we’ve reviewed the functionalities available in the debug toolbar, let’s review the additional tabs in our VS Code editor. In the VARIABLES panel, you can see the values of variables and expressions that were evaluated at the breakpoint.
Additionally, by right-clicking on any of the values in the context menu, you can set Value, Copy Value, or Add to Watch for the variable.
WATCH panelWhen the code is paused, you can bring the values that you want to monitor into view in the WATCH panel. Rather than having to go through the VARIABLES panel each time you want to check a value, you can add a deeply nested property to the WATCH panel for easy access.
This is especially useful for finding the values of numerous variables at once because they are all immediately recalculated during execution.
We can also use unit testing to debug Go applications; unit testing helps to ensure that each component of the application performs its intended function properly. Let’s look at how we can debug Gol application using unit testing in Visual Studio.
Create a test file named main_test.go and add the following code to the file:
package main
import "testing"

func average(score1, score2, score3 int) int {
    return ((score1 + score2 + score3) / 3)
}
func Test_arerage(t *testing.T) {
    score1, score2, score3 := 10, 18, 41

    averageScore := average(score1, score2, score3)
    if averageScore == 0 {
        t.Fail()
    }

}
The two functions above enable us to calculate the average value of three numbers. The function to be tested (Test_average) is preceded by the Test_ keyword. To run the unit test, enter the command below:
go test
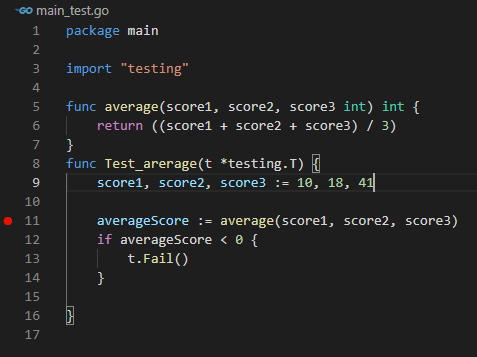
Now let’s debug our test file by adding a breakpoint to the program as shown below:
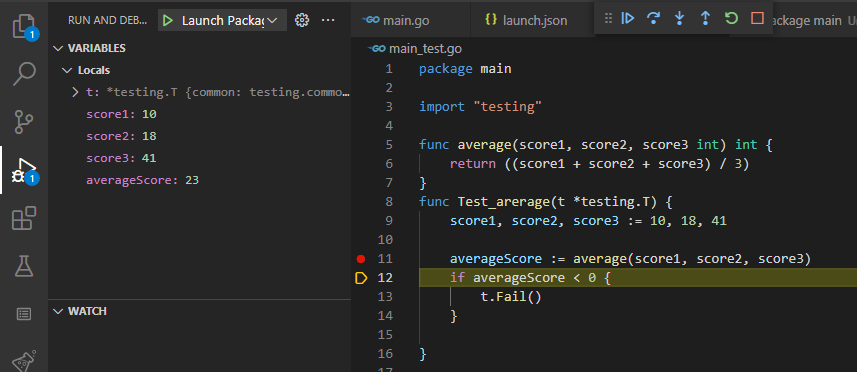
Now you can start the debugging session, then use the Debug Tool to step over and inspect each variable and change their value under the variables section.
In this article, we covered some of the fundamentals for debugging Go applications with Visual Studio Code. The VS Code editor offers helpful plugins that make debugging easy.
We can add breakpoints, conditional breakpoints, and logpoints to pause our code execution, allowing us to deeply inspect what went wrong. We also explored some of the shortcuts available in the debug toolbar, which allow us to navigate through our code during the debugging process. Lastly, we covered some of the functionalities in the VARIABLES panel and the WATCH panel.
To learn more, be sure to check out the online documentation. I hope you enjoyed this tutorial! Please leave a comment if you have any questions.
Install LogRocket via npm or script tag. LogRocket.init() must be called client-side, not
server-side
$ npm i --save logrocket

// Code:

import LogRocket from 'logrocket';
LogRocket.init('app/id');
// Add to your HTML:

<script src="https://cdn.lr-ingest.com/LogRocket.min.js"></script>
<script>window.LogRocket && window.LogRocket.init('app/id');</script>
Would you be interested in joining LogRocket's developer community?
Join LogRocket’s Content Advisory Board. You’ll help inform the type of content we create and get access to exclusive meetups, social accreditation, and swag.
Sign up now
A breakdown of the wrapper and container CSS classes, how they’re used in real-world code, and when it makes sense to use one over the other.

This guide walks you through creating a web UI for an AI agent that browses, clicks, and extracts info from websites powered by Stagehand and Gemini.

This guide explores how to use Anthropic’s Claude 4 models, including Opus 4 and Sonnet 4, to build AI-powered applications.

Which AI frontend dev tool reigns supreme in July 2025? Check out our power rankings and use our interactive comparison tool to find out.
4 Replies to "Debugging Go with VS Code"
This is an absolutely incredible tutorial, it works with VSCode Devcontainer as well btw – I had a really hard time finding a proper tutorial but this one finally got it working. Thank you sir!
Install -v githup.com/go-delve/cmd/dlv@latest
I think here it needs to be
go Install -v githup.com/go-delve/cmd/dlv@latest
Couldn’t really easily follow the tutorial as it claimed. A number of the information was a little misleading, eg:
1. Install Delve extension in VS Code is not correct, it is actually to perform Go Install on the delve package.
2. the instruction on what one should see in the VS code didn’t match what I saw on my VS Code which was version 1.70.2, I needed to figure out how to get there.
3. Setting up condition breakpoint should not include the curly brackets. BTW, why did you give an example that wouldn’t work ? The code was having variable “userinfos”, your example of conditional breakpoint used variable “user”
Thank you, this was actually really helpful. Didn’t think that it would actually work since it’s a random post, but hey here we are.