Developers who are new to JavaScript and web development usually try to start debugging using the console.log() method. Other popular debugging methods include console.error() and console.table().
Like most professional JavaScript developers do, I used the traditional approach to JavaScript debugging, the breakpoint-based technique, for several years before I got bored with the old-fashioned workflow. I wanted to try a different, more productive, engaging debugging approach by going beyond the browser’s Sources tab, where debugging activities usually occur.
While experimenting with Chrome DevTools console features, I found some less popular features that could improve the efficiency of the traditional breakpoint-based debugging approach. With these features, I was able to enhance my debugging productivity drastically. I could even effectively use some console features as better alternatives to classic breakpoints.
In this article, I’ll introduce and demonstrate the Chrome DevTools console features I use to improve my debugging workflow.
The Replay is a weekly newsletter for dev and engineering leaders.
Delivered once a week, it's your curated guide to the most important conversations around frontend dev, emerging AI tools, and the state of modern software.
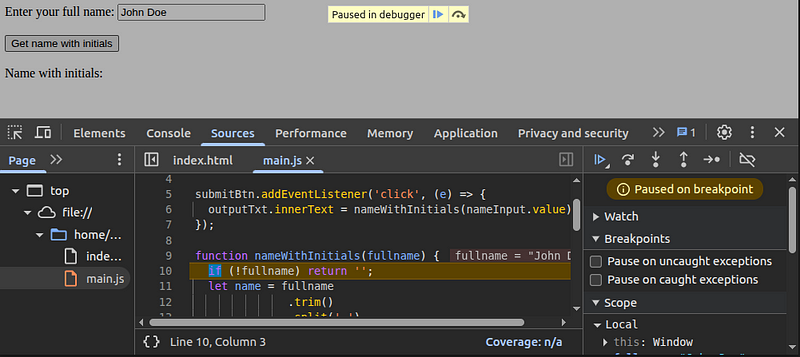
The traditional debugging workflow usually happens within the Sources tab of the DevTools UI with breakpoints. In every collaborative debugging session at my programming job and tutorial video I watched, developers usually began debugging by setting up breakpoints within the Sources tab. They continued the debugging flow by only using features located within the Sources tab, such as watchers, call stack, browser event breakpoints, etc. They rarely used the console to log complex objects, but never went beyond the breakpoints region by using other console features:
This traditional debugging flow has several productivity issues:
console.log() statements instead of setting up breakpointsI could overcome all the above productivity issues in the traditional breakpoint-based debugging approach by effectively using DevTools console features.
Here are the benefits I experienced while using DevTools console features along with breakpoints, or using console features solely without breakpoints for debugging activities:
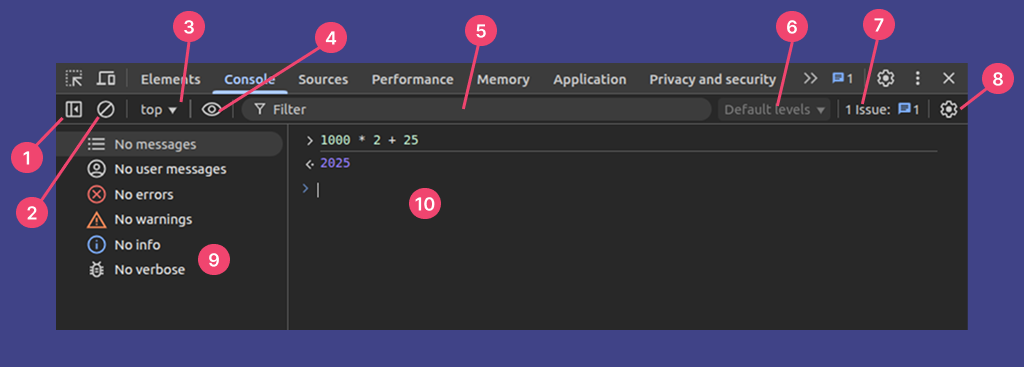
console.log() statementBefore I demonstrate each console feature and how each one helped me debug faster, we need to take a closer look at the important elements of the console, so you can navigate to each feature later easily:
I’ll start with the console shortcuts I use most often. The DevTools console supports arrow-key command navigation, like native OS terminals, and some other shortcut key combinations, especially targeted for debugging productivity:
clear() if I am more engaged with the consoleYou can see a complete list of all supported console keyboard shortcuts in the official DevTools documentation.
I use these console shorthand commands to resolve productivity issues in breakpoint-based debugging, and often use them independently to debug without using breakpoints. In this section, I’ll demonstrate each console utility and explain how each helps me debug faster:
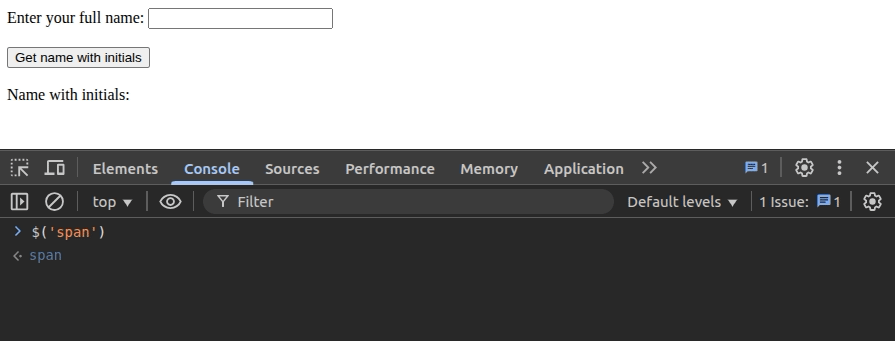
$() and $$()You don’t need to type the full DOM API methods like document.querySelector() to quickly get DOM references in the console during debugging. The shorthand, jQuery-like $() and $$() special functions point to querySelector() and querySelectorAll() API methods, respectively.
I often use these special shorthand functions to find elements quickly from the console without opening the Elements tab:
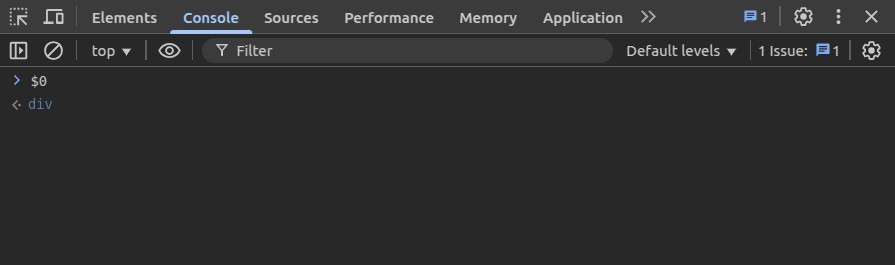
Chrome console lets you access the most recently selected DOM elements using $0, $1, $2,$3, and $4 pre-defined variables. I often use $0 and $1 to select the currently selected DOM element and the previously selected one in the Elements tab without searching for them again.
You can simply type one of these variables on the console and hover over the resultant element to see where it’s located:
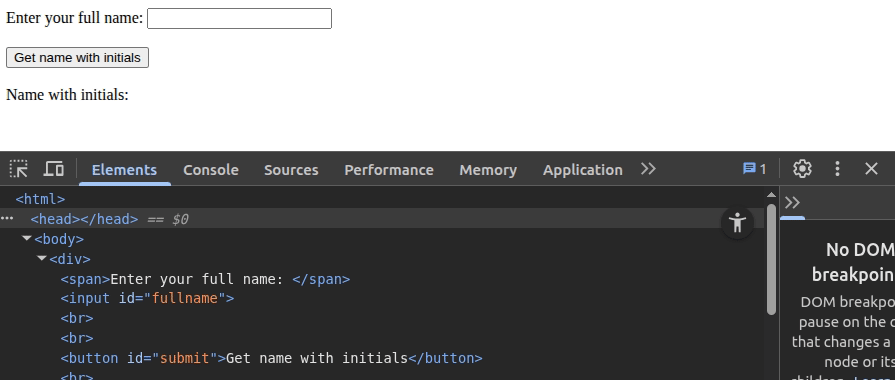
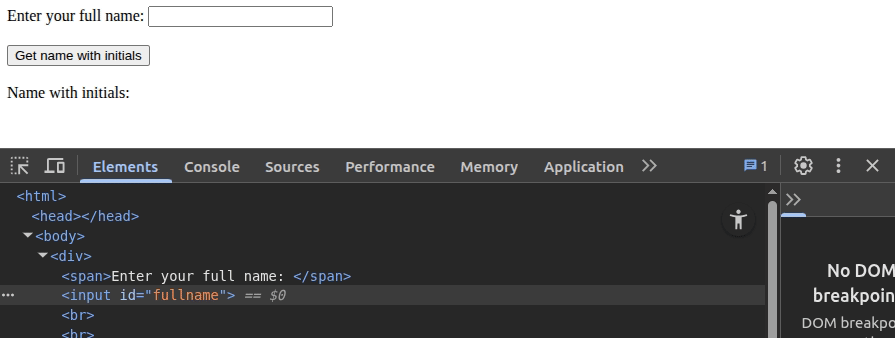
inspect()If you already have a DOM reference, know the CSS selector, or need to inspect one of the recently selected DOM elements, you can use the inspect() function to inspect the particular DOM element. Assume that you need to inspect the first span element. You can do it instantly from the console without inspecting the DOM structure in the Elements tab as follows:
inspect($('span'))
I also use the inspect() utility function with the $1 to quickly inspect the element that I inspected previously:
inspect($1)
When I started using the console to boost debugging productivity by entering shorthand commands, I also started entering quick expressions on the console to test possible solutions for bugs. Moreover, I even started using the DevTools console as a JavaScript playground to try out new solutions before implementation. In these scenarios, the $_ special variable helped me to get the value of the last executed expression.
I often use this while trying out solutions with JavaScript objects as follows:
[1, 2, 10, 11, 14]
$_.filter(n => n % 2 == 0)      // [2, 10, 14]
$_.length                       // 3
Sometimes I use a special variable with inspect(), as well, if I need to inspect an element I retrieved with $():
$('#output')
inspect($_)
dir(), keys(), values(), copy(), and table()Chrome console implements shorthand functions for several objects API methods and the console API methods to help reduce debugging time. Chrome console usually renders logged DOM elements with a special element tree segment, so I often use the dir() function, which maps to console.dir(), to see key-value pair properties of a DOM element:
The console also exports keys() and values() shorthand functions, so we don’t need to type the full object API methods, Object.keys() and Object.values():
const a = {a: 10, b: 10, c: 20}

keys(a)                        // ['a', 'b', 'c']
values(a)                      // [10, 10, 20]
Sometimes, I use the copy() function with these object methods if I need to copy the stringified version of keys or values. For example, the following statement copies all keys of an object to the clipboard:
const a = {a: 10, b: 10, c: 20}

copy(keys(a))
The copy() function also works with strings, so I also use it sometimes to copy string data to the clipboard.
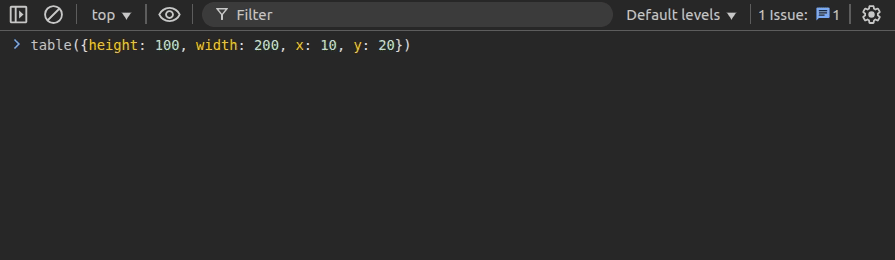
You can also use the table() function instead of typing the complete console.table() function to list tabular data:
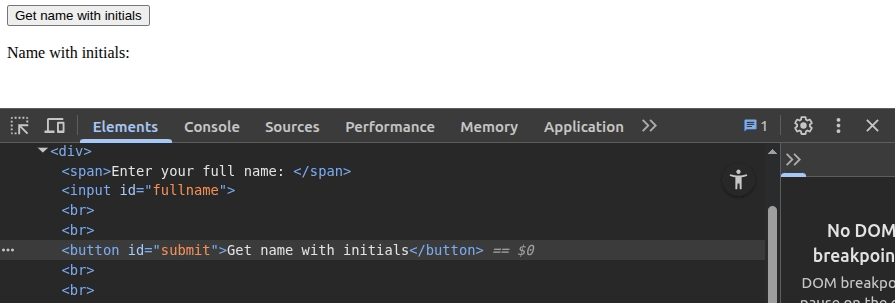
debug()We all know about the debugger keyword that helps us set a breakpoint to a specific code line. You can start debugging a function by adding the debugger keyword within the particular function. You can also debug a function by manually setting a breakpoint from the debugger UI. Now I avoid these two approaches if I know the function name or have a reference to the function while debugging, since I have found that using debug() is more productive.
Here is how you can use debug() to set a breakpoint in a function immediately:
Turning off the breakpoints of a specific function is so easy:
undebug(nameWithInitials)
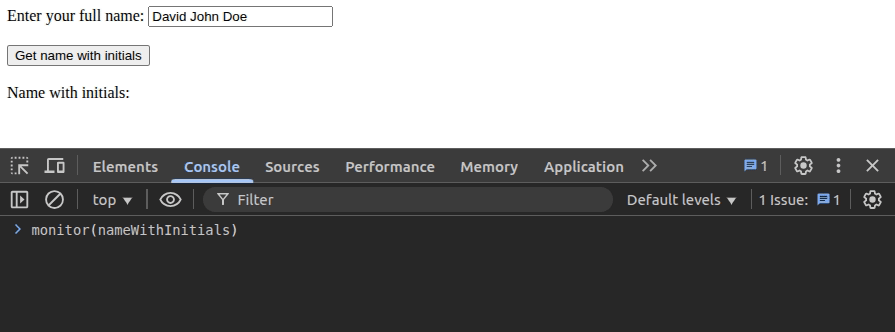
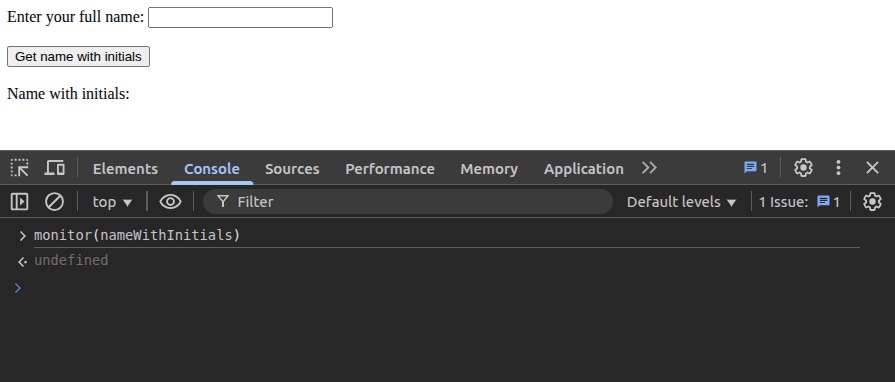
monitor()In debugging activities, we often need to detect function calls and parameters. Setting breakpoints or manually adding a console.log() statement within the specific function are well-known solutions for this, but do you know there is an easier, more efficient way to monitor a function than these two approaches?
I prefer using the monitor() console utility function over traditional breakpoints and log statements for monitoring function calls.
Once you activate monitoring, DevTools will automatically log parameters as follows:
Similar to debug(), you can use the unmonitor() function to deactivate monitoring for a specific function:
unmonitor(nameWithInitials)
monitorEvents()The DevTools Sources tab implements a systematic GUI-based approach to setting breakpoints for DOM element events. The monitorEvents() function offers a way to listen and automatically log events of DOM elements within the console, and it’s undoubtedly more productive than the GUI-based approach. A few months ago, I was able to fix an issue in an infinite scroll implementation using monitorEvents() without using breakpoints.
You can start event monitoring for any DOM element from the console, as demonstrated with the following preview:
monitorEvents($0, 'click')
You can omit the second parameter and monitor all events, or monitor specific events by passing an event name array:
monitorEvents(window)
monitorEvents(window, ['online', 'offline'])
While debugging interactive UI features, sometimes I monitor all mouse and/or keyboard events at once using the event type:
monitorEvents($0, 'mouse')
monitorEvents($0, 'key')
monitorEvents($0, ['mouse', 'key'])
You can turn off event monitoring by using the unmonitorEvents() function, which has the same parameter implementation as monitorEvents(). Browse all supported event types from the official DevTools documentation.
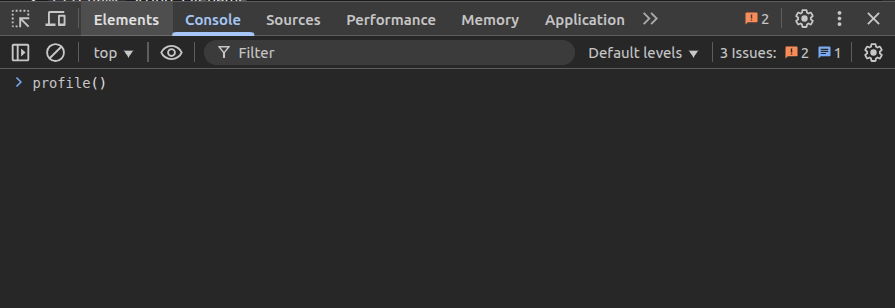
I always do performance profiling evaluations of web apps after implementing a somewhat CPU-intensive feature, before a deployment, or while working on performance-related bugs. If a console panel is open, I often enter profile() and profileEnd() shorthand functions to do a quick performance profile, as demonstrated in the following preview:
Live expressions is an inbuilt DevTools console feature that lets you see real-time results of multiple expressions. I often use this feature while debugging UI-related bugs to monitor UI updates effectively, and sometimes to debug simple JavaScript apps that use dynamic global variables.
Here is how you can monitor a list block’s DOM updates from the console using live expressions:
For simple apps that use global variables, I often set up several live expressions as follows:
You can also use live expressions to monitor changing pre-defined properties like window.activeElement and window.height.
I prefer using error codes while printing error logs on the browser console, so I can easily filter them using the DevTools log message filtering feature as follows:
Because info, warning, or other log messages don’t have a specific code, I usually search them by pressing Ctrl + F. The DevTools console also implements a sidebar that displays a summary of log messages, so you can click on the log message type to filter:
In some debugging scenarios, I have to monitor network requests while monitoring function calls using the monitor() function. Using network breakpoints or looking at the Network tab is less productive when we are engaged with the browser console. So, if I need to inspect network requests while using the console, I activate the “Log XMLHttpRequests” option from the console settings section, then all network requests will appear on the console:
In some debugging scenarios, we have to follow a specific user flow to reproduce bugs reported by users. If we repeatedly perform a long user flow manually to reproduce a bug, the debugging process undoubtedly becomes less productive. In the past, I directly ran some jQuery-based automation scripts on the console to automate such user flows while debugging. Now I use Chrome snippets for automating user flows and run snippets instantly with keyboard shortcuts.
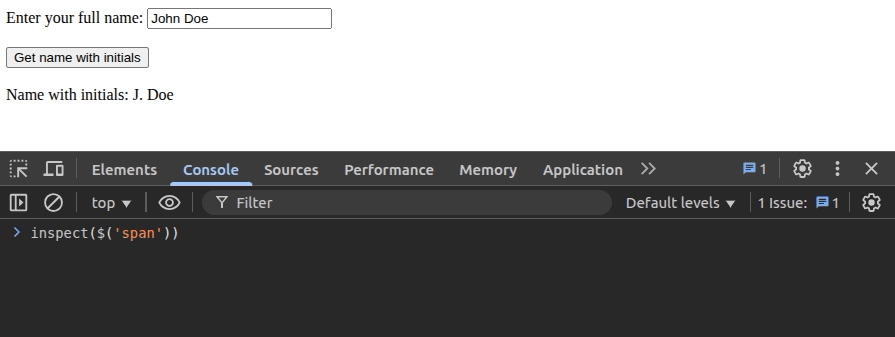
I’ll demonstrate how to automate a simple user flow. Here we have a simple app with a text box and a button:
<div>
  <span>Enter your full name: </span>
  <input id="fullname" /><br/><br/>
  <button id="submit">Get name with initials</button><br/><br/>
  <span>Name with initials: <span id="output"></span></span>
</div>
Assume that you are now debugging its primary functionality. Rather than manually repeating the user flow or copy-pasting an automation script on the console, you can create a snippet as follows:
Here is the snippet we used in the above preview:
const sleep = (t) => new Promise((r) => setTimeout(r, t));

await sleep(500);
document.getElementById('fullname').value = 'John';
await sleep(500);
document.getElementById('fullname').value += ' Doe';
await sleep(500);
document.getElementById('submit').click();
Then, you can play the user flow while debugging using the Command Menu by entering ! after choosing a preferred debugging technique, i.e., monitor() or breakpoints:
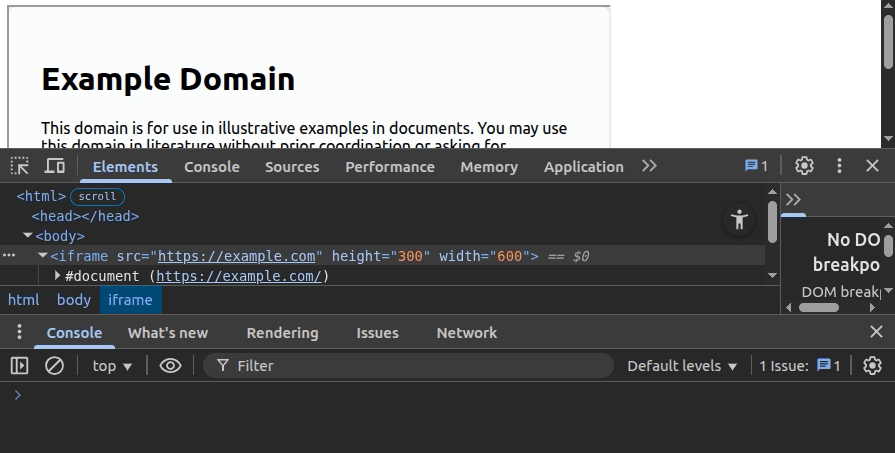
Like the console context changes while running through breakpoints, the console context changes if you change the default context from the JavaScript context dropdown. I often change the console context while debugging web workers or iframes, since I can execute code snippets directly within the worker/iframe context.
For example, you can reload an iframe from the console without using the DOM selector API shortcuts as follows:
Similarly, you can change the JavaScript context of the console and directly execute code snippets within web workers and Chrome extensions. For example, I sometimes simulate web worker messages by changing the context to a specific web worker and entering this:
postMessage('A message from the web worker')
Chrome displays web page issues and recommended enhancements within the Issues tab, and lets developers open it from the console by clicking on the Issues tab shortcut or issue icon on each special console message.
I often look at the Issues tab to make sure there are no page errors, and sometimes further investigate cookie or cross-origin issues without searching the console for particular errors.
Here is how you can instantly open the Issues tab or focus on a specific issue from the console:
In this article, I explained how I improved my past, old-fashioned debugging workflow by effectively using some lesser-known Chrome DevTools console features. I use some of these console features like shorthand console utility variables along with the breakpoint-based debugging approach, and use some console features like live-expressions, monitor(), and monitorEvents() as better alternatives to breakpoints.
If you are also bored with the traditional, old-fashioned breakpoints and seek alternatives or ways to modernize, consider practicing the console features I use. Think of the browser console as the native OS terminal; you’ll also be able to make the debugging experience more engaging and faster.

Discover what’s new in The Replay, LogRocket’s newsletter for dev and engineering leaders, in the April 1st issue.

This post walks through a complete six-step image optimization strategy for React apps, demonstrating how the right combination of compression, CDN delivery, modern formats, and caching can slash LCP from 8.8 seconds to just 1.22 seconds.

Learn what vinext is, how Cloudflare rebuilt Next.js on Vite, and whether this experimental framework is worth watching.

Memory leaks in React don’t crash your app instantly, they quietly slow it down. Learn how to spot them, what causes them, and how to fix them before they impact performance.
Hey there, want to help make our blog better?
Join LogRocket’s Content Advisory Board. You’ll help inform the type of content we create and get access to exclusive meetups, social accreditation, and swag.
Sign up now